
What is Retention Ratio?
The Retention Ratio is the portion of net earnings retained by a company, rather than being paid as dividends to shareholders.
How to Calculate Retention Ratio?
The retention ratio matters because companies reinvesting their net income into their operations implies there are growth opportunities worth pursuing in their current pipeline.
For companies profitable at the net income line (“the bottom line”), there are two options available to the management team in terms of how to use the proceeds:
- Re-Invest in Operations → Maintain possession of those earnings and later use them to fund ongoing operations as well as discretionary growth plans.
- Compensate Equity Shareholders → Issue payments to preferred and/or common shareholders via dividends
If the former is chosen, the percentage of profits that the company opts to hold onto, as opposed to paying out as dividends increases – which is quantified by the retention ratio.
Since the company’s earnings retention is expressed in a percentage, this enables comparisons between peer companies in the same industry.
The inverse of the retention ratio is called the “dividend payout ratio”, which measures the proportion of net income paid out as dividends to shareholders.
When the earnings of companies are credited to retained earnings, instead of dividends, the preserved amount flows into the “Retained Earnings” line item on the balance sheet.
To forecast retained earnings, the process involves taking the prior period balance of retained earnings, adding the net income from the current period, and then subtracting any dividends issued to shareholders.
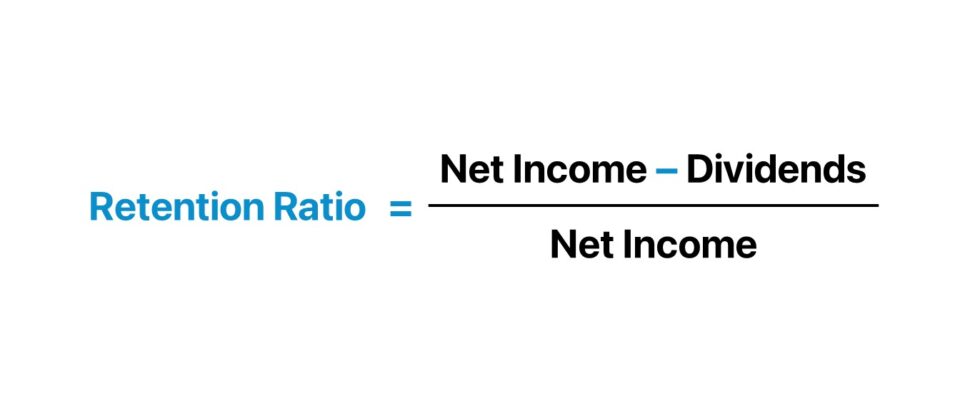
Retention Ratio Formula
To calculate the retention ratio, the formula subtracts the common and preferred dividends distributed from the net income of the current period, and then divides the difference by the current period’s net income value.
Once dividends for the period have been paid out, the remaining profits are considered retained earnings.
With that said, the numerator, in which dividends are deducted from net income, is simply the retained earnings account.
For instance, let’s say a company reported a net income of $100,000 in 2021 and paid $40,000 of annual dividends. In our scenario, the retention ratio is 60%, which was calculated using the following formula:
- Retention Ratio = ($100k Net Income – $40k Dividends Paid) ÷ $100k Net Income = 60%
An alternative method to calculate the retention ratio is by subtracting the payout ratio from one.
Continuing on the prior example, we arrive at a retention ratio of 60% again.
- Payout Ratio = $40k Dividends Paid ÷ $100k Net Income = 40%
- Retention Ratio = 1 – 40% Payout Ratio = 60%
Conceptually, the formula should make sense, given how the retention ratio is the opposite of the payout ratio, which is the percentage of net earnings paid out to shareholders as dividends.
Retention Ratio Calculator
We’ll now move to a modeling exercise, which you can access by filling out the form below.
1. Retention Ratio Calculation Example
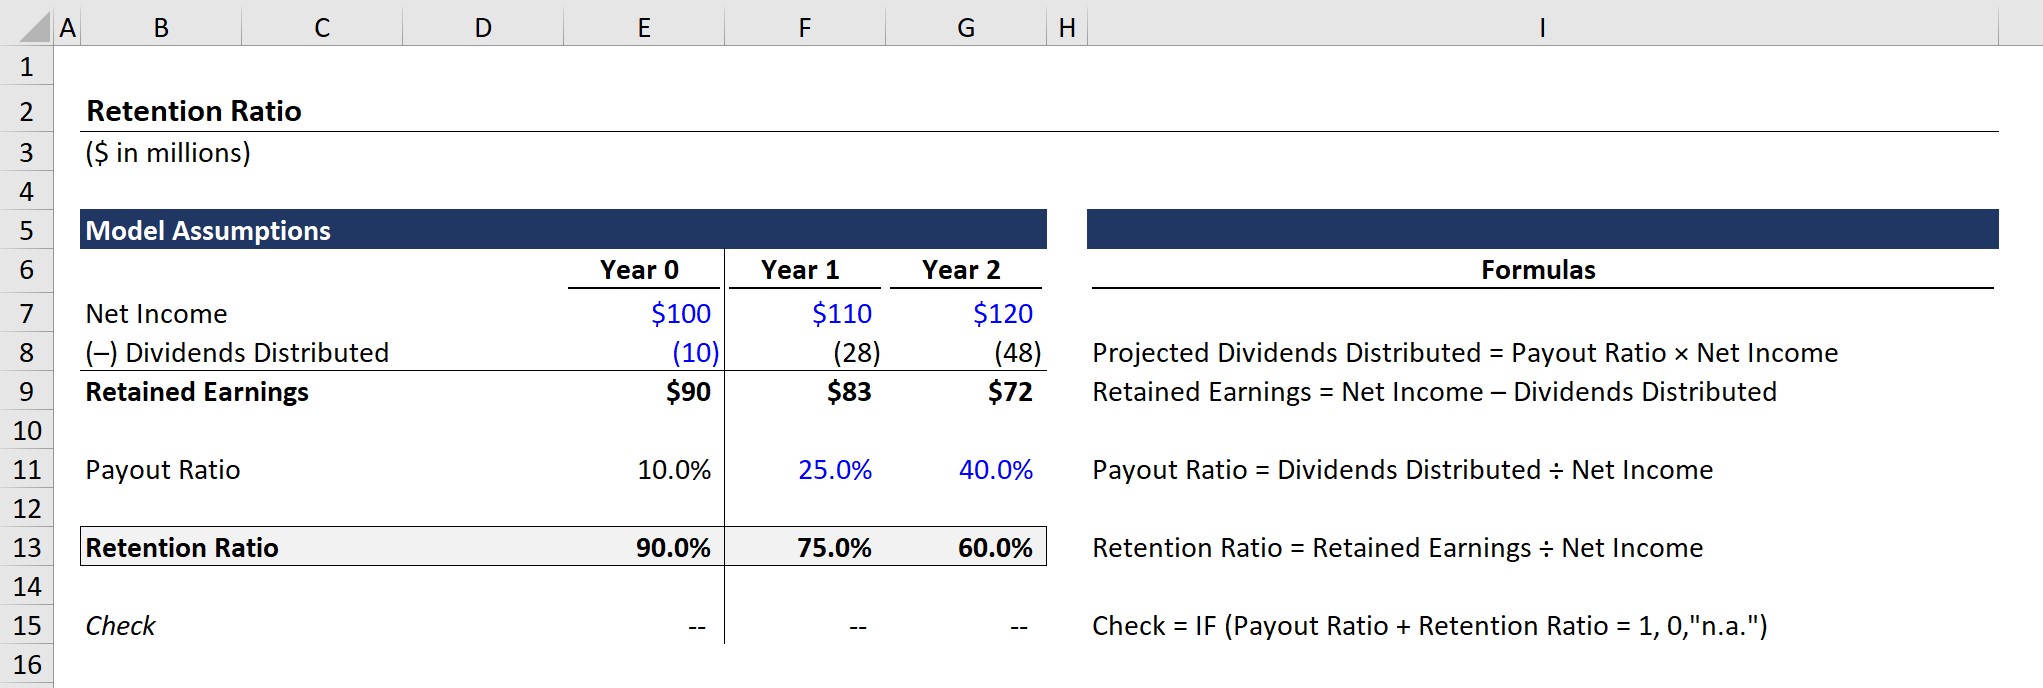
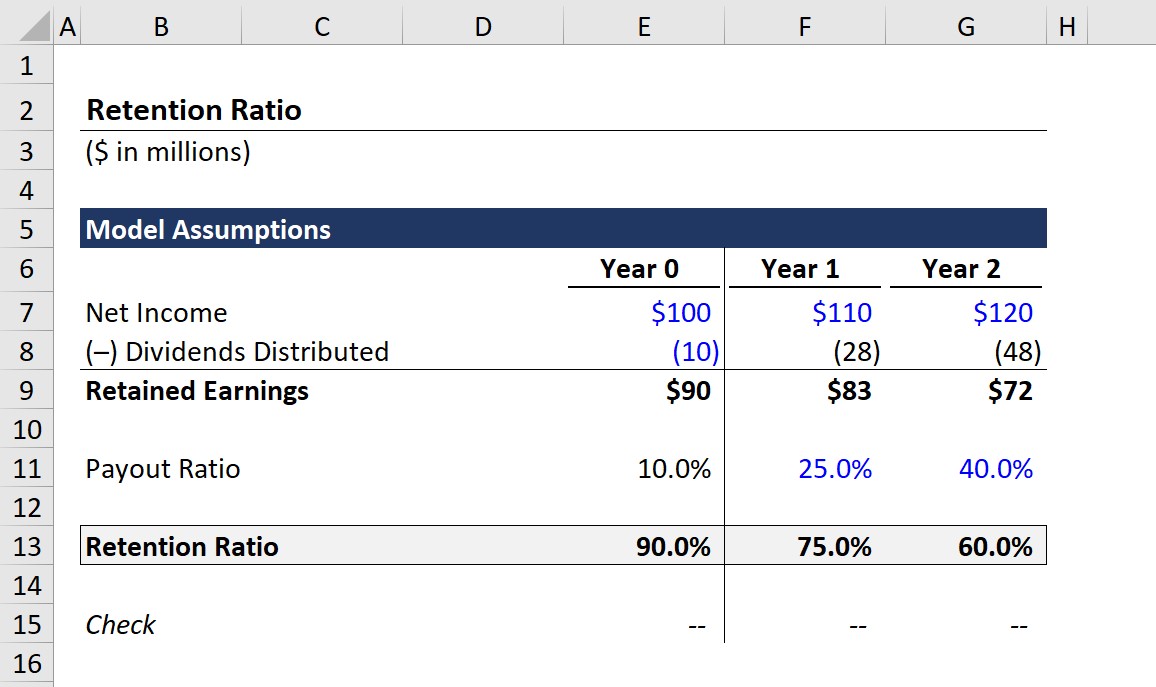
For our simple modeling exercise, we’ll use the following assumptions for the historical financials:
Year 0 Financials
- Net Income = $100m
- Dividends Distributed = $10m
Considering the retained earnings equation is net income minus the dividends distributed, the retained earnings for Year 0 come out to $90m.
- Retained Earnings (Year 0) = $100m Net Income – $10m Dividends Distributed = $90m
Furthermore, the payout ratio is calculated by dividing the dividends distributed by the net income.
- Payout Ratio (Year 0) = $10m Dividends Distributed ÷ 100m Net Income = 10%
As for the retention ratio, the equation is retained earnings divided by net income, as discussed earlier.
- Retention Ratio (Year 0) = $90m Retained Earnings ÷ $100m Net Income = 90%
The 90% retention ratio signifies that net of any dividends paid out to equity shareholders, 90% of the company’s net earnings are kept and accumulated on its balance sheet to be spent on a later date.
2. Retention Ratio Forecast Analysis
In the next section, we’ll practice forecasting retained earnings using the payout ratio, which is directly linked to the retention ratio.
Public companies tend to publicly disclose their plans for dividends issuance programs – whether it be a long-term plan or a one-time special dividend.
However, rather than also explicitly announcing their retention plans, retention metrics must be calculated using the relationship between dividends and retained earnings.
To project the retained earnings balance in Year 1 and Year 2, we’ll be using two assumptions:
Payout Ratio Assumptions
- Year 1 = 25%
- Year 2 = 40%
Given the increasing payout of dividends, we’d expect retained earnings to decline even with the $10m year-over-year (YoY) increase in net income.
- Retained Earnings (Year 1) = $83mm
- Retained Earnings (Year 2) = $72mm
Confirming our statement from earlier, the inverse of the payout ratio is the retention ratio, so we can see that the sum of the two ratios equals 100% in all three years in the completed model output.
What Factors Impact the Retention Ratio?
Considering the retention ratio – also known as the “plowback ratio” – indicates the amount of retained profits, the fact that a company would decide to keep its profits tends to be a positive sign that management is confident about its future business growth opportunities.
However, this interpretation is based on the assumption that management is rational and makes corporate decisions with the “best interests” of its shareholders in mind.
As a general rule, the retention ratio is typically lower for mature, established companies with large cash reserves.
Often, such companies are referred to as “cash cows”, as they are characterized by large market share in a mature, single-digit growth industry.
Consequently, these types of companies have minimal reinvestment needs and have essentially developed into steady, turnkey businesses following years of strong growth to become market leaders.
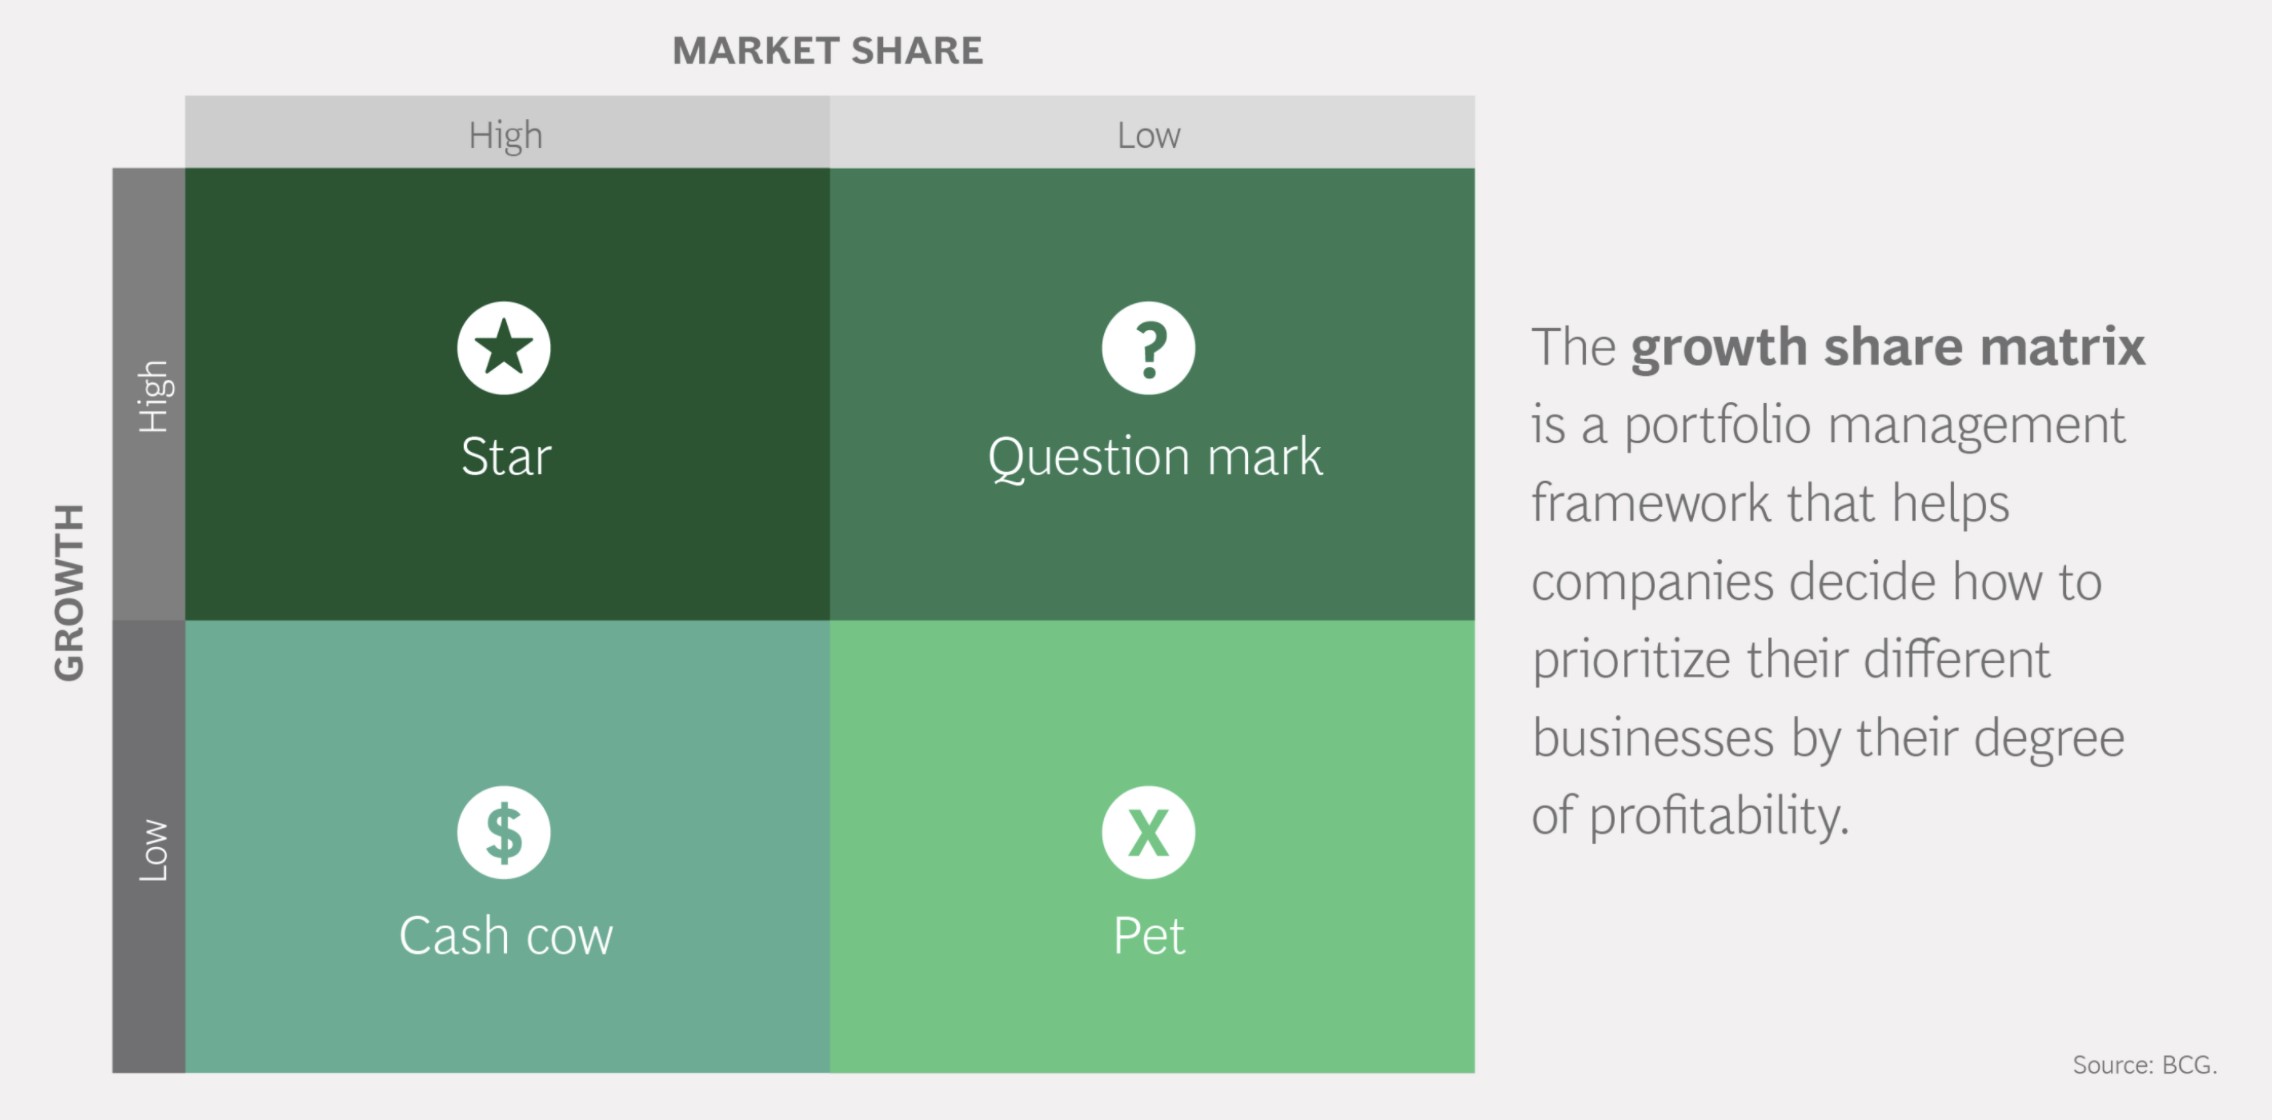
Boston Consulting Group Growth-Share Matrix (Source: BCG)
Here, the decision-making process depends on whether the projects in the current pipeline could be undertaken at the present date. If not, it is often because the risks associated with the projects are not justified by the potential returns.
On the other hand, a high-growth company riding a positive trajectory in terms of market expansion and new customer acquisitions would be far more likely to retain earnings, as there are more projects worth undertaking.
To expand further, growth-stage companies require additional cash to fund upcoming investments in assets (i.e. capital expenditures) and other strategic operational investments into:
- Sales and Marketing (S&M)
- Advertising Campaigns
- Business Development Representatives
- General and Administrative (G&A), e.g. Customer Service and Support
What is a Good Retention Ratio?
There are exceptions to the rules, generalizing that low-growth companies have low retention ratios (and vice versa).
For instance, a mature company might have a high retention ratio due to a business model oriented around acquiring competitors or adjacent companies in the market (i.e. growth through acquisitions/M&A).
If a company operates in a capital-intensive industry (e.g. automobiles, oil & gas) that requires large funds to maintain their current output, this industry dynamic would require higher retention rates.
And along the same lines, companies with cyclical operating performance must preserve more cash to withstand an economic downturn.
The final consideration is that the act of retaining more of its earnings should not always be interpreted as a positive indicator, as confirmation is required to ensure the capital is being spent effectively and efficiently via metrics such as the:
Therefore, the retention ratio should be used in conjunction with other metrics to assess the actual financial health of a company.

Everything You Need To Master Financial Modeling
Enroll in The Premium Package: Learn Financial Statement Modeling, DCF, M&A, LBO and Comps. The same training program used at top investment banks.
Enroll Today

")
")

