
What is the Plowback Ratio?
The Plowback Ratio is the percentage of a company’s earnings retained and reinvested into operations as opposed to being paid out as dividends to shareholders.
How to Calculate the Plowback Ratio?
The plowback ratio, also known as the “retention ratio,” is the fraction of a company’s net earnings that are retained to be reinvested into its operations.
Management’s decision to hold onto earnings could suggest that there are currently profitable opportunities worth pursuing.
The inverse of the plowback ratio — the “dividend payout ratio” — is the proportion of net income paid out in the form of dividends to compensate shareholders.
Considering that higher retention indicates more growth potential, a higher dividend payout ratio should result in lower growth expectations, i.e. the two are inversely related.
If a company opted to pay out a large percentage of its earnings as dividends, no (or minimal) growth should be expected out of the company.
The rationale behind a long-term dividend program is typically that growth opportunities are limited and the company’s pipeline of potential projects has been exhausted; thus, the best course of action to maximize shareholder wealth is to pay them directly via dividends.
Plowback Ratio and Implied Growth Formula
In theory, greater retention of earnings and rates of reinvestment into profitable projects should coincide with higher near-term growth rates (and vice versa).
A higher plowback ratio implies a higher growth rate, all else being equal.
As a result, a company’s growth rate (g) can be approximated by multiplying its return on equity (ROE) by its plowback ratio.
Growth Formula
- g = ROE × b
Where:
- g = Growth Rate (%)
- ROE = Return on Equity
- b = Plowback Ratio
The plowback ratio, however, cannot be used as a standalone metric, as just because earnings are retained does not mean it is being spent efficiently. The ratio should therefore be tracked alongside the following return ratios:
Plowback Ratio and Company Lifecycle
If a company is profitable at the net income line — i.e. “the bottom line” — there are two main options for management to spend those earnings:
- Re-Invest: The net earnings can be kept and then be used to fund ongoing operations (i.e. working capital needs), or discretionary growth plans (i.e. capital expenditures).
- Dividends: The net earnings can be used to compensate shareholders; i.e., direct payments can be made to either preferred and/or common shareholders.
The retention ratio is generally lower for mature companies with established market shares (and large cash reserves).
But for companies in high-growth sectors at risk of disruption and/or numerous competitors, constant reinvestment is typically necessary, which leads to lower retention.
Capital-Intensive / Cyclical Industries
Note that not all market-leading, established companies have low retention ratios.
For example, companies operating in capital-intensive industries such as automobiles, energy (oil & gas), and industrials must constantly spend significant amounts of money just to maintain their current output.
Capital-intensive industries are also often cyclical in performance, which further creates the need for retaining more cash on hand (i.e. withstand a slowdown in demand or global recession).
Plowback Ratio Formula
One method to calculate the plowback ratio is to subtract common and preferred dividends from net income, and then divide the difference by net income.
After dividends for the period have been paid out to shareholders, the residual profits are called retained earnings, i.e. net income minus dividend distributions.
Formula
- Plowback Ratio = Retained Earnings ÷ Net Income
Plowback Ratio Calculator – Excel Template
We’ll now move to a modeling exercise, which you can access by filling out the form below.
Plowback Ratio Calculation Example
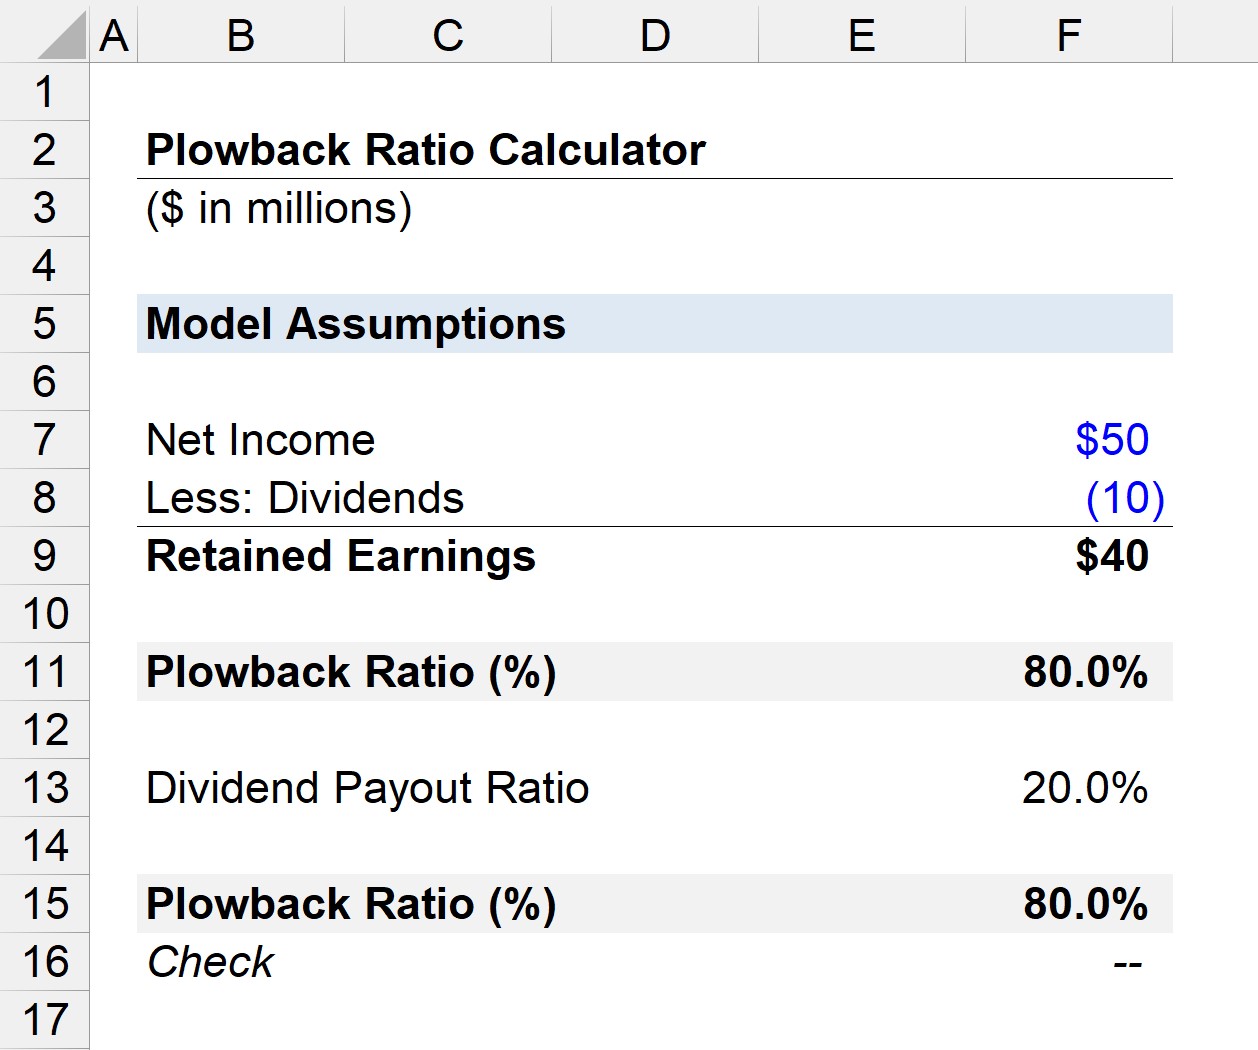
Suppose a company has reported a net income of $50 million and paid $10 million in dividends for the year.
- Plowback Ratio = ($50 million – $10 million) ÷ $50 million = 80%
In our illustrative scenario, the plowback ratio is 80%, i.e. the company paid out 20% as dividends, and the remaining 80% was kept to be reinvested at a later date.
An alternative method to calculate the ratio is to subtract the dividend payout ratio from one.
Formula
- Plowback Ratio = 1 – Payout Ratio
Recall that the plowback ratio is the inverse of the payout ratio, so the formula should be intuitive since the sum of the two ratios must equal one.
Using the same assumptions as in the prior example, we can calculate the plowback ratio by subtracting 1 minus the 20% payout ratio.
- Payout Ratio = $10 million ÷ $50 million = 20%
We can then subtract the 20% payout ratio from 1 to calculate a plowback ratio of 80%, which aligns with the previous calculation.
- Plowback Ratio = 1 – 20% = 80%
Plowback Ratio — Per Share Calculation
The plowback ratio can also be calculated using per-share figures, with the two inputs consisting of:
Let’s assume that a company has reported earnings per share (EPS) of $4.00 and paid an annual dividend per share (DPS) of $1.00.
The company’s dividend payout ratio is equal to the earnings per share (EPS) divided by the dividend per share (DPS).
- Payout Ratio = $1.00 ÷ $4.00 = 25%
Considering that 25% of the company’s net earnings were paid out as dividends, the plowback ratio can be calculated by subtracting 25% from 1.
- Plowback Ratio = 1 – 25% = .75, or 75%
In conclusion, 75% of the company’s net earnings were kept for future reinvestment, while 25% was paid out to shareholders as dividends.
The Wharton Online & Wall Street Prep Applied Value Investing Certificate Program
Learn how institutional investors identify high-potential undervalued stocks. Enrollment is open for the Feb. 10 - Apr. 6 cohort.
Enroll Today


