
What is Dividend Yield?
The Dividend Yield is the ratio between the dividend paid per share (DPS) and the current market share price of the issuer, expressed as a percentage.
How to Calculate Dividend Yield
The dividend yield represents how much a company issues in dividends relative to its latest closing share price – i.e., the percentage of its share price paid out in the form of dividends each fiscal year.
The dividend yield is calculated by dividing the annual dividend per share (DPS) by the current market share price and expressed as a percentage.
However, since dividends are paid quarterly, the standard practice is to estimate the annual dividend amount by multiplying the latest quarterly dividend amount per share by four.
Therefore, tracking the dividend yield of a company over time reflects any recent corporate changes regarding the payout policy, which is frequently a reliable proxy to analyze the profitability of the issuer.
The step-by-step process to compute the dividend yield is as follows.
- Calculate Dividend Per Share (DPS) on an Annualized Basis
- Retrieve the Issuer’s Share Price as of the Latest Closing Date
- Divide the Issuer’s Dividend Per Share (DPS) by the Share Price
- Multiply by 100 to Convert the Dividend Yield into Percentage Form
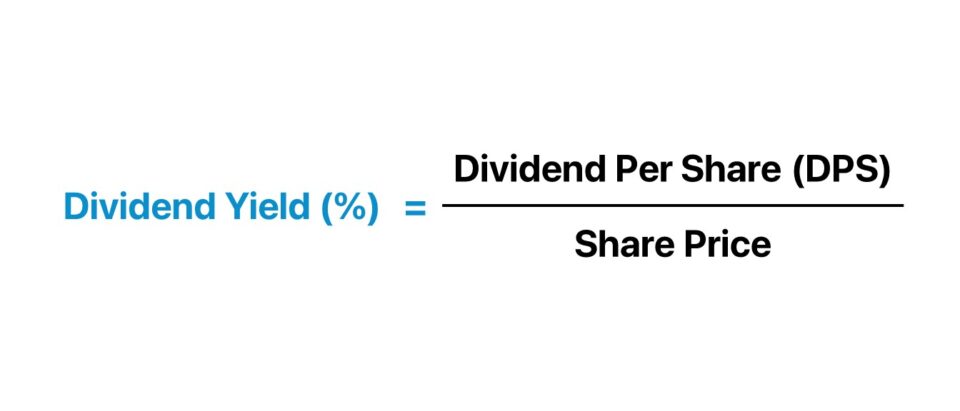
Dividend Yield Formula
The formula for calculating the dividend yield is equal to the dividend per share (DPS) divided by the current share price.
Where:
For example, if a company is trading at $10.00 in the market and issues annual dividend per share (DPS) of $1.00, the company’s dividend yield is equal to 10%.
- Current Stock Price = $10.00
- Dividend Per Share (DPS) = $1.00
- Dividend Yield (%) = $1.00 ÷ $10.00 = 10%
The Wharton Online & Wall Street Prep Applied Value Investing Certificate Program
Learn how institutional investors identify high-potential undervalued stocks. Enrollment is open for the Feb. 10 - Apr. 6 cohort.
Enroll TodayWhat is a Good Dividend Yield?
If a company’s dividend yield has been steadily increasing over time, such changes could be interpreted positively if caused by an increasing dividend payout. But if the increase stems from a declining share price, that would be a concerning sign.
Management’s decision to cut future dividend amounts – either for the foreseeable future or on a temporary basis – can also cause a company’s dividend yield to decline.
However, considering companies are reluctant to cut dividends once implemented, a public announcement that the current dividend payout will be cut is practically always perceived negatively by the market.
Hence, there tends to be a drop-off in a company’s share price following news that its dividend is being reduced (or completely cut) – as investors tend to assume the worst.
On the topic of what a “good” dividend yield is, the answer is entirely contextual. Company-specific factors such as its stage in its lifecycle, growth opportunities, and shareholder base are all examples of key considerations.
In addition, industry factors must be taken into account, such as the cyclicality in revenue.
An important distinction here is that a high dividend yield does NOT mean that the issuer is financially healthy and profitable (and vice versa). For instance, the high yield could be the result of management deciding not to cut the dividend in fear of a significant decline in share price.
Corporate Dividend Payout Policy Decision
The maturity of the company and the defensibility of its market share (i.e. number of new entrants and the threat of disruption) must be taken into consideration when it comes to peer comparisons.
Mature companies in established markets tend to pay regular dividends with consistent dividend yields.
But companies earlier in their lifecycle experiencing high growth – assuming the company is profitable – tend to reinvest their earnings for further growth instead of issuing dividends.
Generally, the metric is most useful for comparisons to historical yields, as well as to the industry average, rather than for direct comparisons with peers, given the number of variables that can impact the dividend policies between companies.
Dividend Yield vs. Payout Ratio: What is the Difference?
Another popular metric for investors is the dividend payout ratio.
While the dividend yield is the rate of return of dividends paid to shareholders, the dividend payout ratio is how much of a company’s earnings are paid out as dividends instead of being retained.
Certain investors believe the dividend payout ratio is a better indicator of a company’s ability to distribute dividends consistently in the future. The dividend payout ratio is highly connected to a company’s cash flow.
Since the yield is denoted as a percentage, shareholders can easily assess their expected returns per dollar invested.
Dividend Yield Calculator
We’ll now move to a modeling exercise, which you can access by filling out the form below.
Dividend Yield Calculation Example
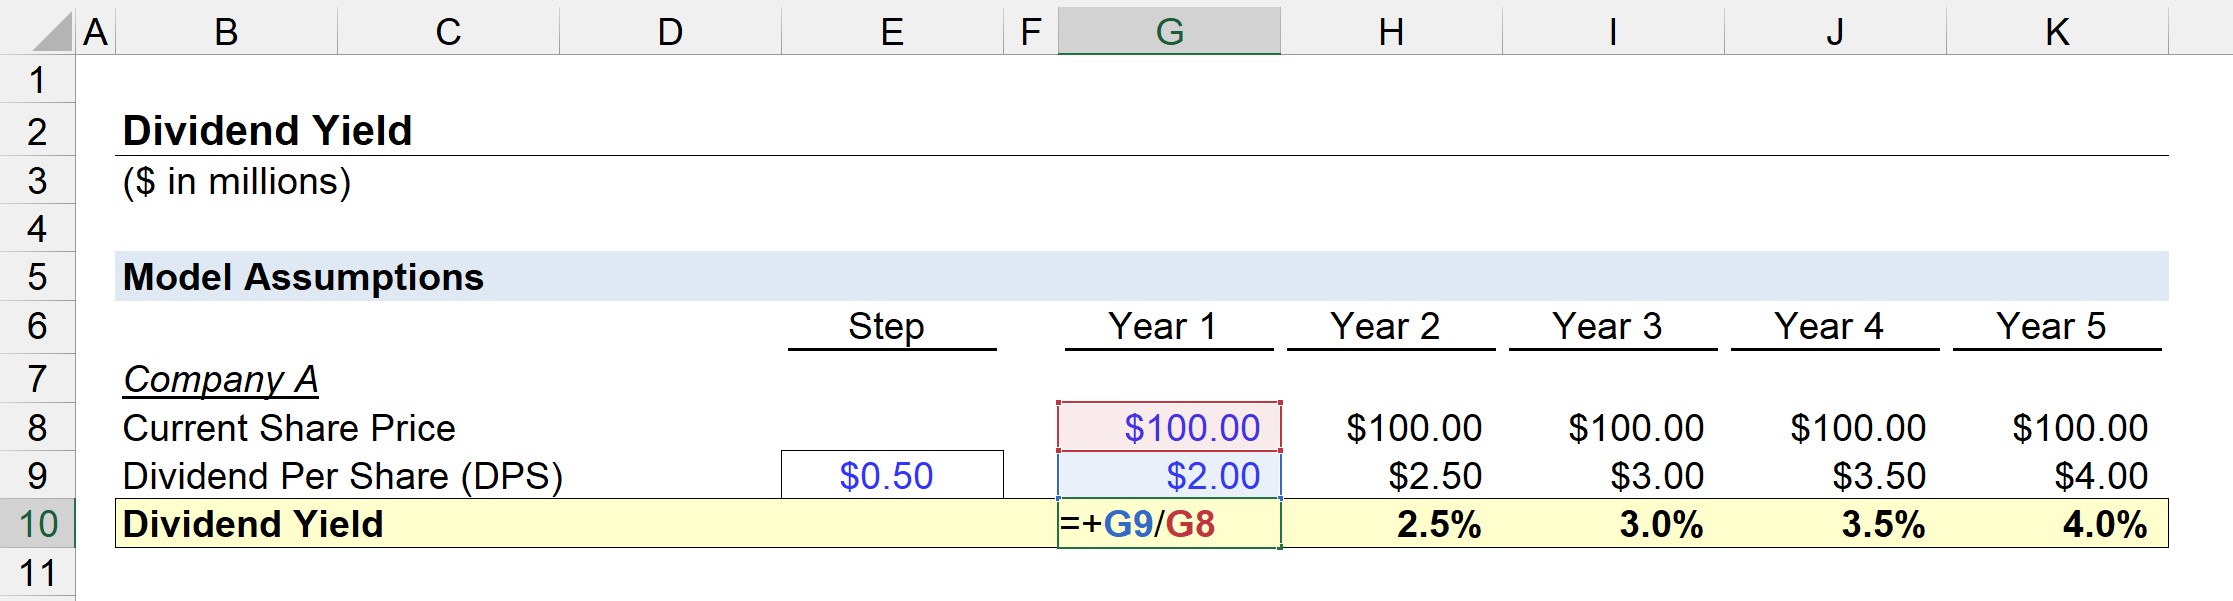
Suppose we have two companies – Company A and Company B – each trading at $100.00 with an annual dividend per share (DPS) of $2.00 in Year 1.
- Current Share Price, Year 1 = $100.00
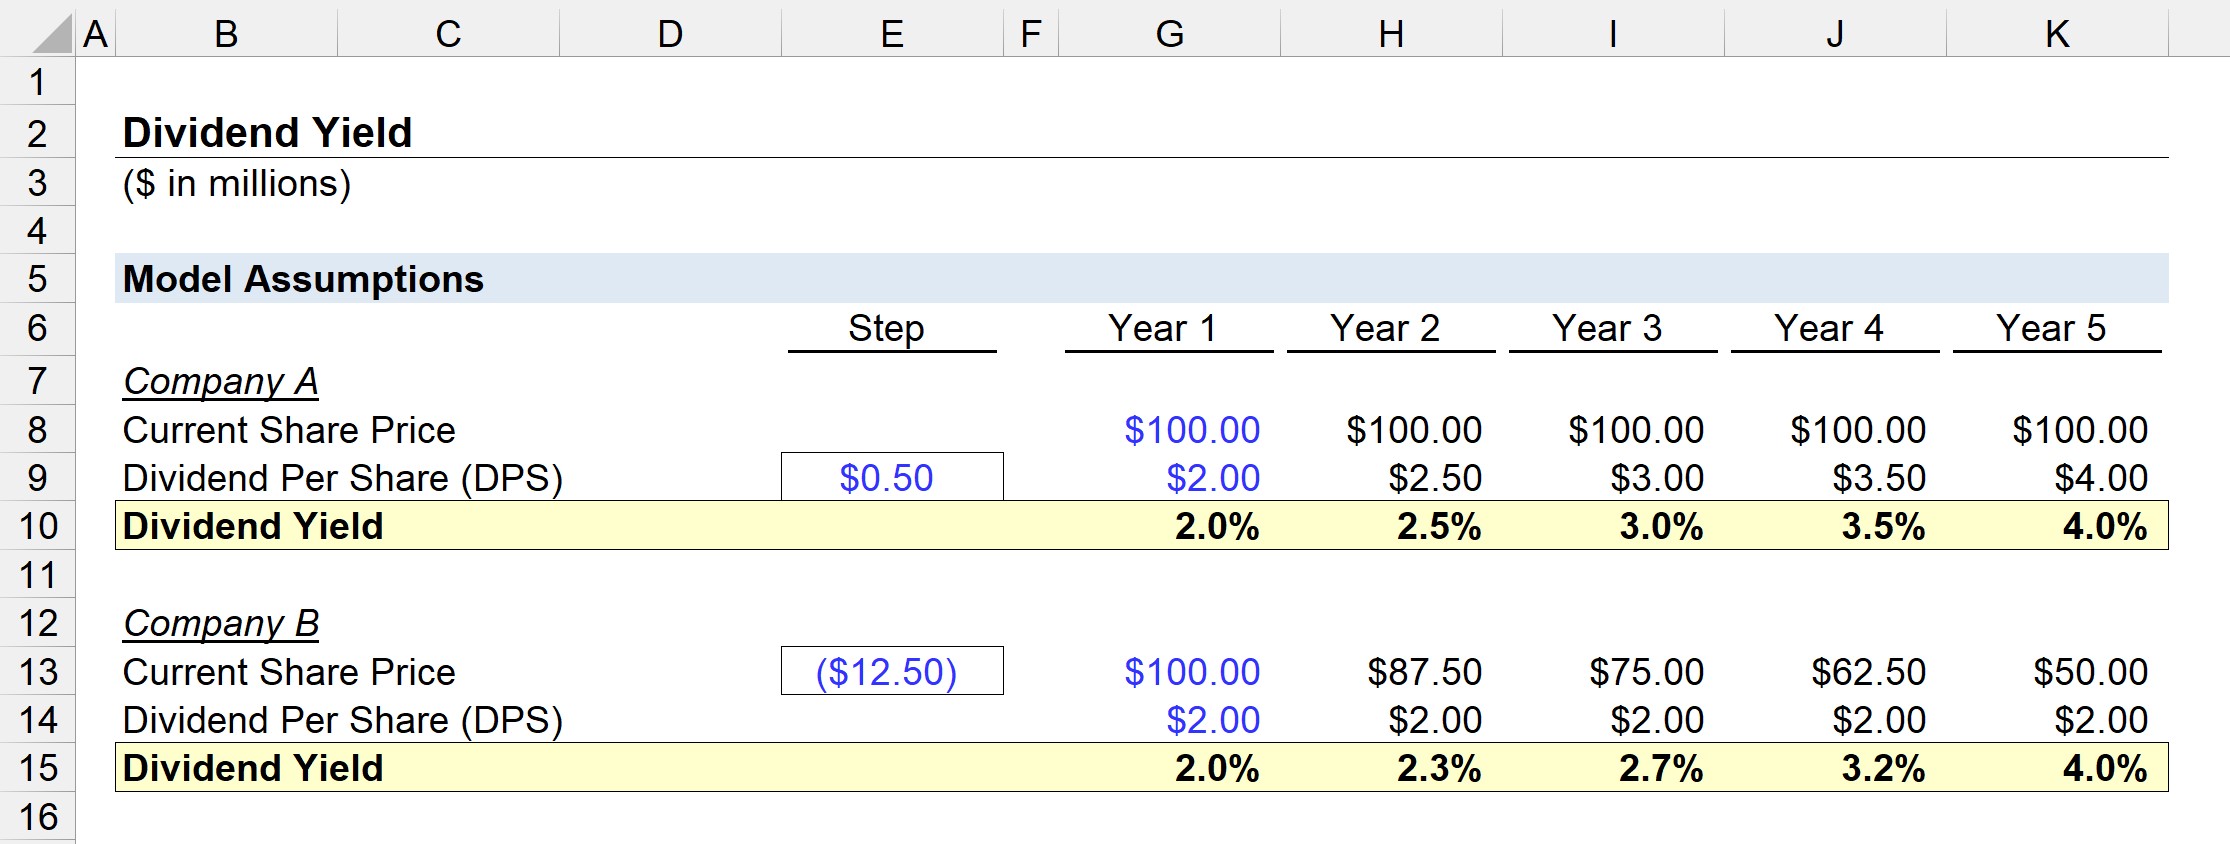
From Year 2 to Year 5, Company A’s dividend per share (DPS) will increase by $0.50 each year until reaching $4.00 by the end of the forecast, whereas the dividend per share (DPS) of Company B will remain constant at $2.00.
Across the same time horizon, Company B’s share price will decline by $12.50 each year – falling to $50.00 by the end of Year 5.
The dividend yield of Company A and Company B can be determined by dividing the current share price by the dividend per share (DPS) in each period.
For example, the dividend yield for the two companies is 2.0% in Year 1.
- Dividend Yield (%) = $2.00 ÷ $100.00 = 2.0%
The dividend yield of our two hypothetical companies rises from 2.0% in Year 1 to 4.0% in Year 5.
However, the cause of each company’s yield increase determines whether the increase should be determined positively or negatively.
Company A is likely to become more profitable and, therefore, increase the dividend payout to shareholders.
By contrast, Company B’s share price has effectively been cut in half, implying some underlying issues, such as an earnings miss or a negative shift in market sentiment, which illustrates the necessity of using other financial metrics in conjunction with the dividend yield.
")


