
- What is DuPont Analysis?
- 3-Step DuPont Analysis Model
- DuPont Formula
- What are the DuPont Analysis Ratio Components?
- 5-Step DuPont Analysis Model
- DuPont Analysis Calculator — Excel Template
- 1. Balance Sheet Assumptions
- 2. 3-Step DuPont Analysis Calculation Example
- 3. 5-Step DuPont Analysis Calculation Example
- 4. DuPont Analysis Model Interpretation
What is DuPont Analysis?
DuPont Analysis is a framework used to break apart the underlying ratio components of the return on equity (ROE) metric to determine the strengths and weaknesses of a company.
Originally devised in the 1920s by Donaldson Brown at DuPont Corporation, the chemical company, the model is used to analyze the return on equity (ROE) as broken down into different parts in order to analyze the contribution of each part.
3-Step DuPont Analysis Model
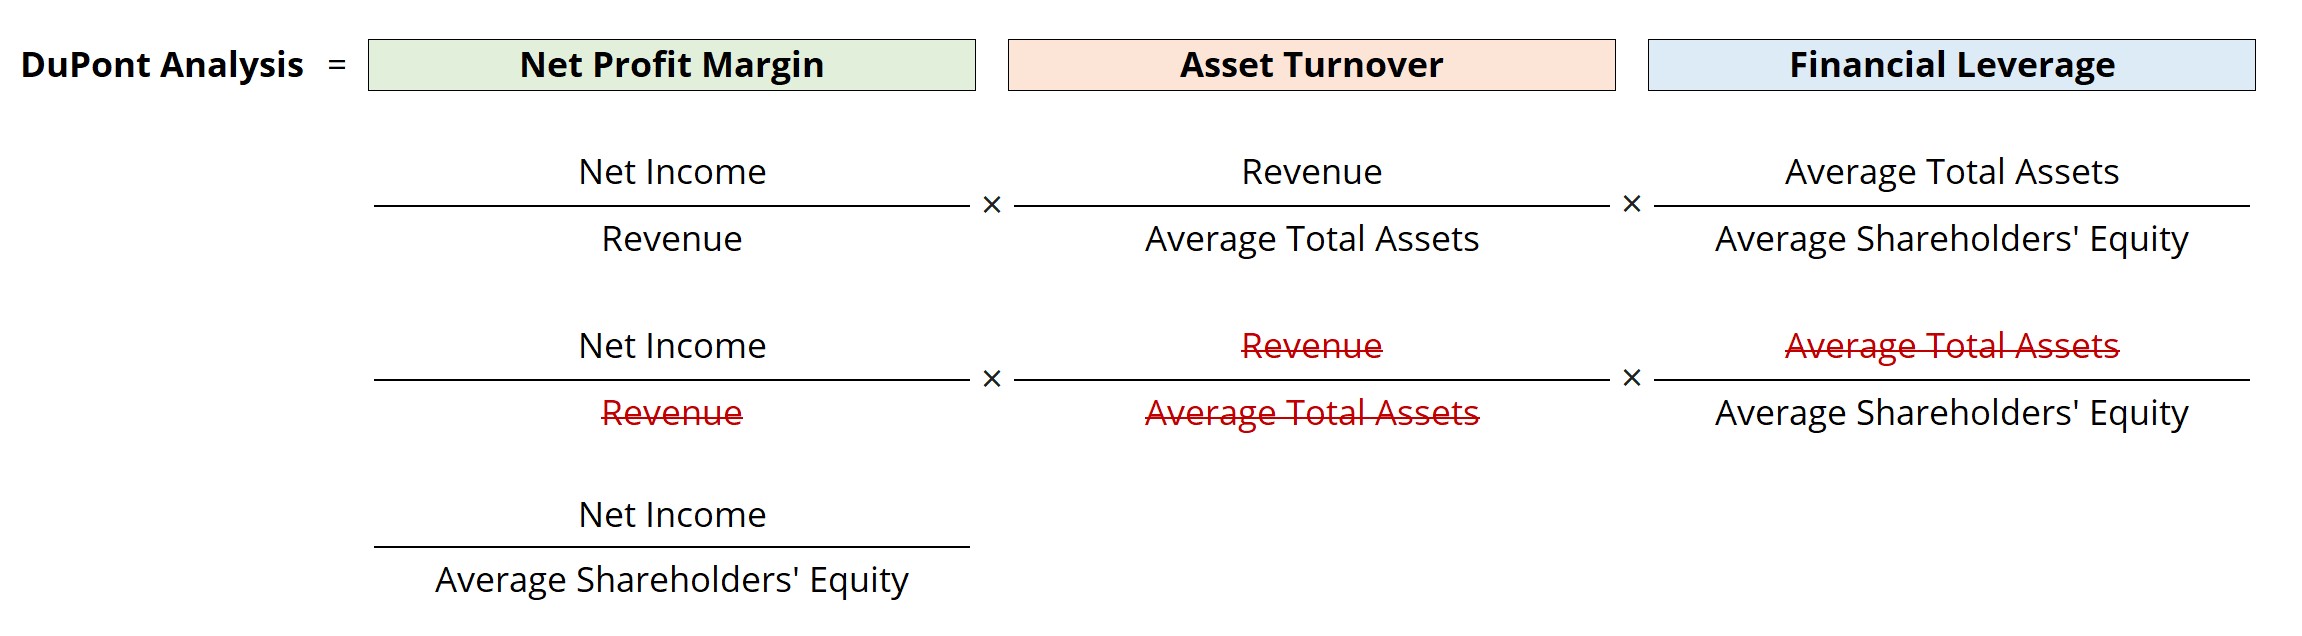
The 3-step DuPont analysis model states that if the net profit margin, asset turnover, and financial leverage of a company are multiplied, the output is the company’s return on equity (ROE).
In the 3-step DuPont model – the simpler version between the two approaches – the return on equity (ROE) is broken into three ratio components:
- Net Profit Margin = Net Income ÷ Revenue
- Asset Turnover = Revenue ÷ Average Total Assets
- Financial Leverage Ratio = Average Total Assets ÷ Average Shareholders Equity
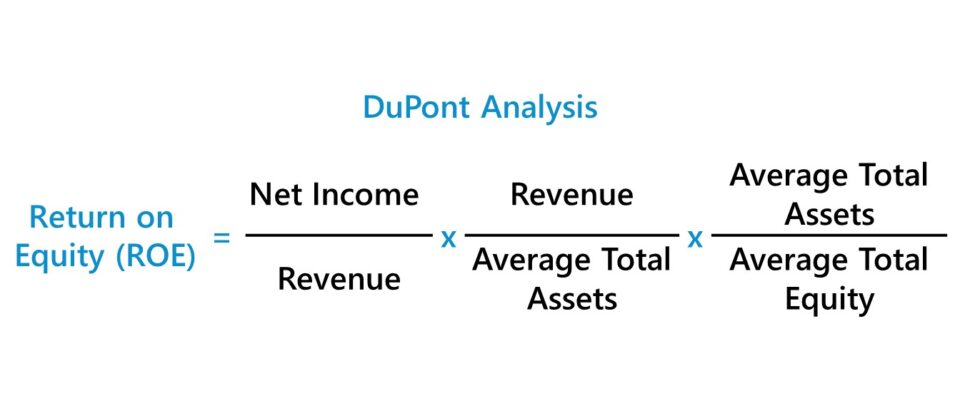
The starting point to arrive at these three components is the return on equity (ROE) formula.
If we multiply the ROE formula above by two ratios – “Revenue ÷ Revenue” and “Average Total Assets ÷ Average Total Assets” – we are essentially multiplying the ROE by one, since the numerator and denominator are the same in both ratios.
But with some rearranging of the terms, we arrive at the three standard ratios mentioned earlier.
DuPont Formula
The 3-step DuPont formula shown below is the most commonly used equation:

Upon splitting up the return on equity (ROE) calculation into these three components, the changes in ROE can be better understood and what is driving the net increase (or decrease).
The DuPont analysis implies that a company can increase its return on equity (ROE) via the following:
- Generates Higher Net Profit Margin
- Efficiently Utilizes Assets to Generate More Revenue
- Increases its Financial Leverage
What are the DuPont Analysis Ratio Components?
1. Net Profit Margin Ratio
- The net profit margin represents a company’s “bottom line” profitability once all expenses have been deducted, including the interest expense payments on debt obligations and taxes to the government.
- If the net profit margin increases, each dollar of revenue will bring in more earnings to the company, resulting in a higher return on equity (ROE).
- Therefore, a company’s net income represents the remaining profits left over, which are attributable to one specific group of capital providers – the equity shareholders.
2. Asset Turnover Ratio
- For the second component, the total asset turnover ratio is an efficiency ratio tracking the ability of a company to generate more revenue per dollar of asset owned.
- If a company improves upon its turnover ratio, the ROE increases because the implication is that it can utilize its assets better – i.e. generate more revenue with fewer assets.
- The first two components – 1) net profit margin and 2) total asset turnover – represent measures of operating efficiency and asset efficiency.
3. Financial Leverage Ratio
- The third and final component, financial leverage, refers to the total amount of debt in the company’s capital structure.
- The greater the reliance on debt financing, the higher the periodic interest expense owed to the lender, which causes the risk of default to rise.
- However, interest expense is tax-deductible and creates a “tax shield” that reduces the amount of taxable income (EBT).
- Often called the “equity multiplier,” increasing the amount of debt to benefit from the lower taxes, the lower cost of capital, and obtaining access to a cheaper funding source could easily backfire from irresponsible decision-making – hence, the company must be led by a management team with their interests aligned with that of its shareholders.
- The company must strike the right balance between benefiting from debt financing but not placing excess leverage on the company, where the company’s cash flows are insufficient to handle all the debt obligations and are now at risk of default.
5-Step DuPont Analysis Model
The five ratio components of the 5-step DuPont formula are as follows:
- Tax Burden = Net Income ÷ Pre-Tax Income
- Asset Turnover = Revenue ÷ Average Total Assets
- Financial Leverage Ratio = Average Total Assets ÷ Average Shareholders’ Equity
- Interest Burden = Pre-Tax Income ÷ Operating Income
- Operating Margin = Operating Income ÷ Revenue

There are two additional components in the 5-step equation as compared to the 3-step equation.
To expand further upon the additional parts of this formula:
- Tax Burden → The proportion of profits retained post-taxes.
- Interest Burden → The extent to which interest expense impacts profits
- Operating Margin → The operating profit (EBIT) retained per dollar of sales after deducting cost of goods sold (COGS) and operating expenses (OpEx).
All three of these new parts are extensions of the net profit margin calculation.
DuPont Analysis Calculator — Excel Template
We’ll now move to a modeling exercise, which you can access by filling out the form below.
1. Balance Sheet Assumptions
Suppose we’re tasked with calculating a company’s return on equity (ROE) using the DuPont analysis model.
In our illustrative exercise, we will assume there are three different operating scenarios:
- “Downside” Case
- “Base” Case
- “Upside” Case
For our projections, we’ll use the “Downside” case as our starting point. We’ll also use a step function and use different step values for the other two cases.
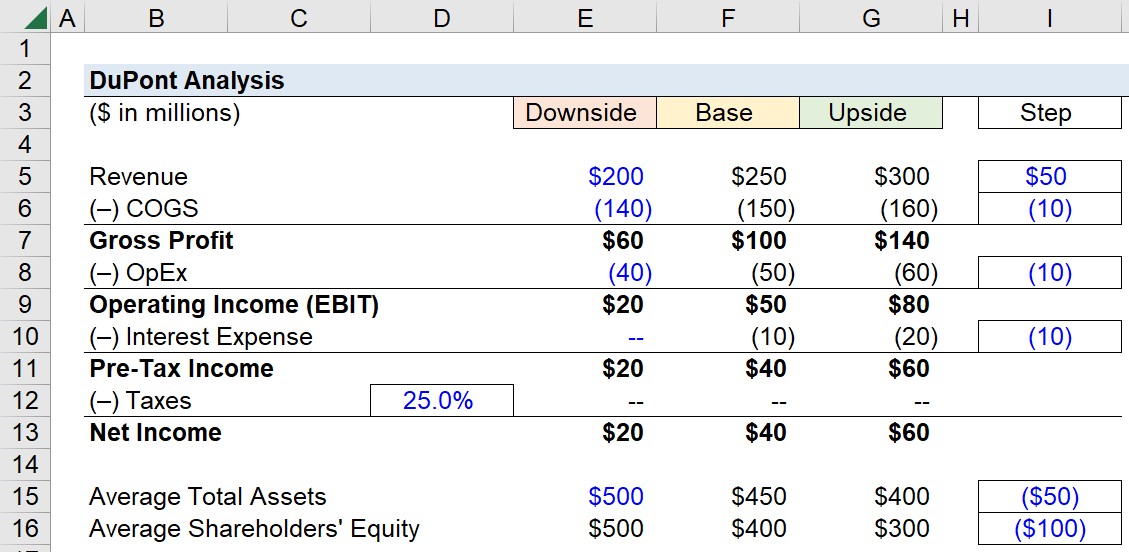
Downside Case:
- Revenue: $200m
- Cost of Goods Sold (COGS): –$140m
- Operating Expenses (OpEx): –$40m
- Interest Expense: $0m
Then, from those figures, we’ll use the following step functions – i.e. the value of the hard-coded number in blue font is added to the cell on the left.
Base and Upside Case (I/S Step Function):
- Revenue: +$50m
- COGS: –$10m
- OpEx: –$10m
- Interest Expense: –$10m
- Tax Rate: 25% – Constant in Each Case
Next, we’ll move on to the balance sheet assumptions, for which we only require two data points, the “Average Total Assets” and “Average Shareholders’ Equity” accounts.
B/S Downside Case:
- Average Total Assets: $500m
- Average Shareholders’ Equity: $500m
B/S Base and Upside Case (Step Function):
- Average Total Assets: ($50m)
- Average Shareholders’ Equity: ($100m)
Since there is no debt in the capital structure in the “Downside” case, the total assets must equal the average shareholders’ equity for the balance sheet to remain in balance.
2. 3-Step DuPont Analysis Calculation Example
We now have all the required inputs to calculate ROE using both the 3-step and 5-step DuPont approaches.
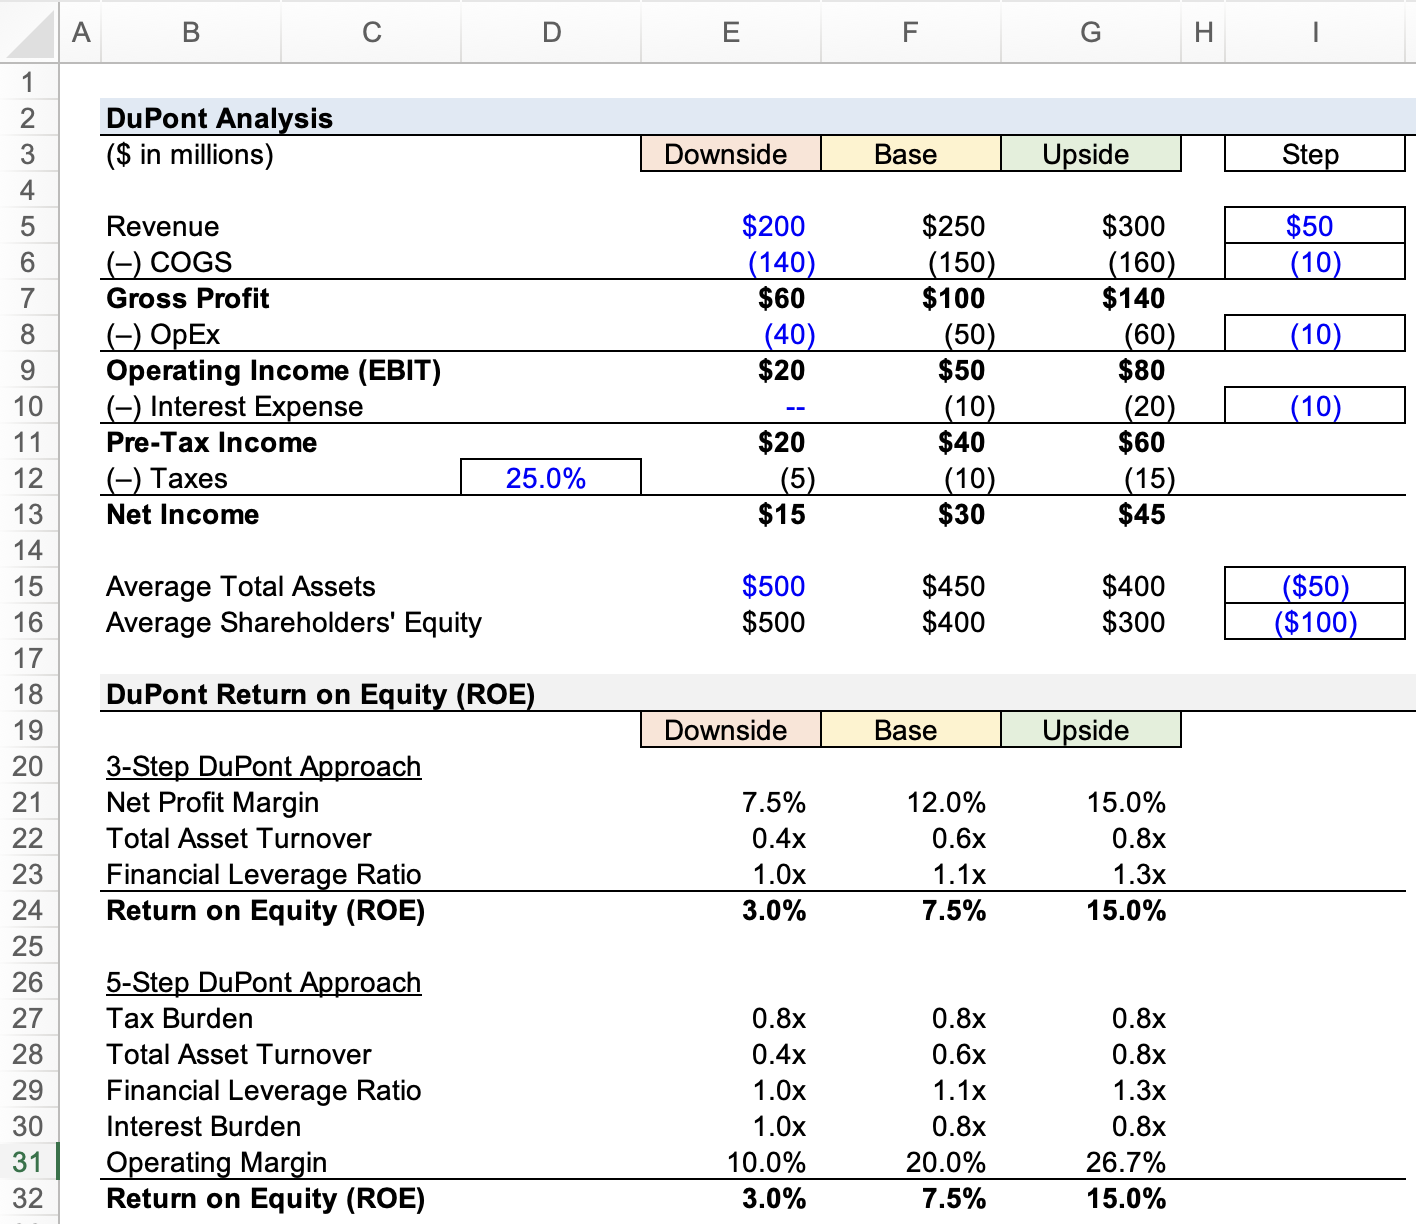
To calculate the company’s return on equity (ROE) under the 3-step approach, we can use the following formula:
3. 5-Step DuPont Analysis Calculation Example
In the next part of our modeling exercise, we’ll calculate the ROE under the 5-step approach.
The formula for calculating each input is listed on the side, while the ROE formula can be seen in the highlighted cells.
From our completed model output, the return on equity (ROE) comes out to:
- ROE, Downside Case = 3.0%
- ROE, Base Case = 7.5%
- ROE, Upside Case = 15.0%
4. DuPont Analysis Model Interpretation
The fact that the return on equity (ROE) is equal in both the 3-step and 5-step approaches confirms our model is correct, including their fundamental connection.
Simply put, the 5-step approach takes the basic approach a tad bit further by getting more into the specifics regarding net income.
In our hypothetical scenario, the two major contributors to the variance in the implied return on equity (ROE) values – derived from our DuPont analysis model – is the margin expansion in profitability (i.e. net profit margin, operating margin) and the improvement in efficiency at utilizing assets to generate incremental revenue (i.e. total asset turnover ratio).

Everything You Need To Master Financial Modeling
Enroll in The Premium Package: Learn Financial Statement Modeling, DCF, M&A, LBO and Comps. The same training program used at top investment banks.
Enroll Today")
")
")


What is the formula for finding the PM when the ROE, equity multiplier and the Total Asset turnover is known?
It is very helpful for the first time learner of Financial Accounting. Now I am in a position to analyse any business at least by Bird’s eye view Thank you
Thanks. This was helpful.
thanku,, i like the way u explained how the ROE under DUPONT was derived#multiplications,,made it clear and memorisable