What is the Treynor Ratio?
The Treynor Ratio is a measure of a portfolio’s excess return per unit of systematic risk, or the market volatility of the portfolio.
Often referred to as the “reward-to-volatility ratio”, the Treynor ratio attempts to gauge the risk attributable to a portfolio (and the expected returns) in the context of the total non-diversifiable risk inherent to the market.
How to Calculate Treynor Ratio
The Treynor ratio captures the difference between a portfolio’s total return and the risk-free rate, which is subsequently adjusted for the amount of risk undertaken on a per-unit basis.
Designed by economist Jack Treynor, who also created the capital asset pricing model (CAPM), the ratio is used by investors to make informed decisions regarding asset allocation and portfolio diversification.
In particular, the Treynor ratio is used to perform comparative analysis among different funds to compare the historical track record of a specific portfolio manager (and investment fund).
From the perspective of an investor, the insights derived from comparing the risk-adjusted fund returns contributes toward the selection of which funds to allocate their capital to.
Calculating the Treynor ratio requires three inputs:
- Portfolio Return (Rp) → Usually, the portfolio return is based on a backward-looking average, such as the portfolio returns in the past five years. If the returns from one year of performance were to be used, the chance of misinterpreting the ratio would be very high since returns can fluctuate substantially, especially for firms that utilize riskier strategies.
- Risk-Free Rate (Rf) → In the U.S., the risk-free rate is most often the yield on Treasury bonds since the default risk is essentially zero, i.e. if the government were at risk of defaulting, it could technically print more money to avoid default.
- Beta of the Portfolio (β) → The last variable is the beta of the portfolio, which is a frequently criticized — yet commonly used — measure of risk in investing and portfolio management. Since a portfolio is a collection of assets, a weighted average must be taken of each asset’s sensitivity to movements within the broader market.
Treynor Ratio Formula
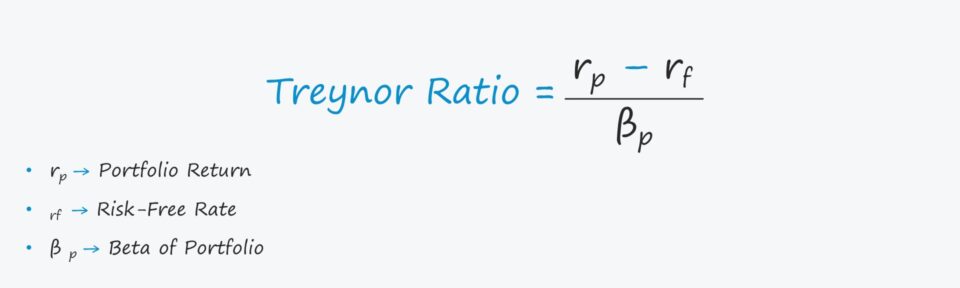
The formula for calculating the Treynor ratio is as follows.
Where:
- rp = Portfolio Return
- rf = Risk-Free Rate
- βp = Beta of the Portfolio
Note: In order for the ratio to be meaningful, all the figures in the numerator must be positive.
The Wharton Online & Wall Street Prep Applied Value Investing Certificate Program
Learn how institutional investors identify high-potential undervalued stocks. Enrollment is open for the Feb. 10 - Apr. 6 cohort.
Enroll TodayWhat is a Good Treynor Ratio?
A higher Treynor ratio should result in greater expected risk-adjusted returns — all else being equal.
As mentioned earlier, the risk-free rate represents the return received on default-free securities, i.e. government bonds.
Moreover, the ratio represents the excess returns above the risk-free rate, meaning a higher ratio is preferred because it suggests greater returns on the portfolio, with the opposite being true for a lower ratio.
But since the ratio is derived using historical data and past performance, it is an imperfect indicator of future performance (and should be evaluated alongside other relevant metrics).
Treynor Ratio vs. Sharpe Ratio: What is the Difference?
The Treynor ratio is similar to the Sharpe ratio in many aspects because both metrics attempt to measure the risk-return trade-off in portfolio management.
While the Sharpe ratio measures all elements within the total portfolio risk (i.e. systematic and unsystematic), the Treynor ratio only captures the systematic component.
Portfolio managers and investors tend to prefer the Treynor ratio over the Sharpe ratio for well-diversified portfolios, as only the systematic risk is left, i.e. the effects related to unsystematic risk were theoretically removed from diversification.
Treynor Ratio Calculator
We’ll now move to a modeling exercise, which you can access by filling out the form below.
Treynor Ratio Calculation Example
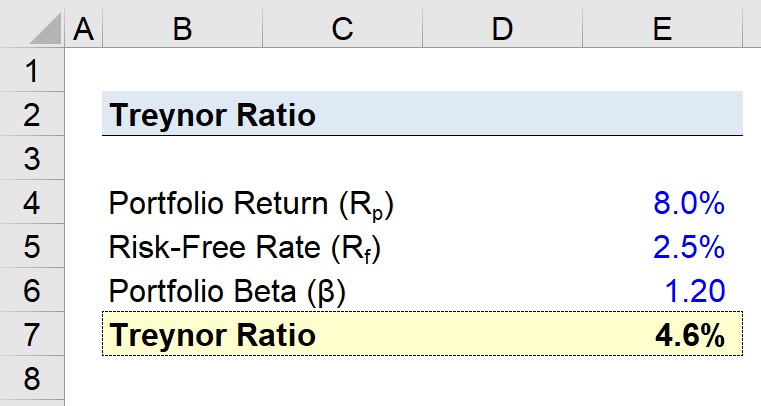
Suppose an investment firm’s portfolio has averaged a return of 8.0% over the trailing five years.
If the risk-free rate is 2.5% and the historical beta of the portfolio is 1.20, what would the Treynor ratio of the fund be?
- Portfolio Return = 8.0%
- Risk-Free Rate = 2.5%
- Beta of Portfolio = 1.20
Since the formula subtracts the risk-free rate from the portfolio return and then divides the result by the beta of the portfolio — we arrive at a Treynor ratio of 4.6%.
- Treynor Ratio = (8.0% – 2.5%) / 1.20 = 4.6%
The implied 4.6% risk-adjusted return seems fair assuming the fund strategy is long-only equities, but to reiterate from earlier, it must be used in conjunction with other metrics to make a definitive conclusion.