
- What is TAM?
- How to Calculate Total Addressable Market (TAM)
- Total Addressable Market (TAM) Formula
- Market Sizing: How to Analyze TAM
- TAM vs. SAM vs. SOM: What is the Difference?
- TAM vs. Market Share: What is the Difference
- TAM Example: Airbnb Market Opportunity
- Flaws of TAM: Uber IPO Example (Bill Gurley)
What is TAM?
The Total Addressable Market (TAM) is the estimated market demand for a certain product or service, which can be used to size the implied revenue opportunity attributable to a particular company.
Conceptually, the TAM is an estimate of the total demand that exists in the market for a particular product or service, which can be used to determine the maximum revenue opportunity.
How to Calculate Total Addressable Market (TAM)
The TAM, a shorthand abbreviation for “Total Addressable Market”, is a measure of the entire revenue potential within a particular market (or sub-market).
In simple terms, the total addressable market (TAM) reflects the revenue that a company could theoretically generate, assuming a 100% market share.
For companies of all sizes—ranging from early-stage startups to established, low-growth companies—market sizing is an essential step in determining the growth potential of the company.
- Early-Stage ➝ Startups estimate the market size to see if a market, and the implied revenue opportunity, is worth undertaking the risk.
- Growth-Stage ➝ Growth companies track the market size to measure their progress at capturing market share and to estimate the remaining upside potential that can be attained.
- Late-Stage ➝ Mature companies are attentive to the market size to decide if the current revenue is sustainable or if a strategic pivot is necessary via market expansion (i.e. introduce new products or services, expand into international markets).
The total addressable market (TAM) of a company can be expressed in terms of the total number of potential customers, split out by customer types (e.g. SMBs, large enterprises).
However, the far more prevalent method in practice is for the TAM to be measured in terms of revenue rather than potential customers.
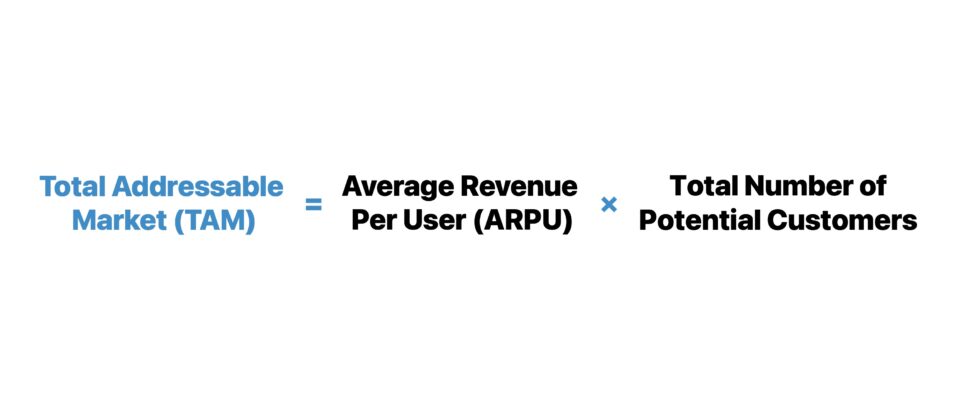
Total Addressable Market (TAM) Formula
The most basic method to estimate the total addressable market (TAM) is the top-down method.
The top-down approach provides a broad estimate by multiplying the average revenue per user (ARPU) by the total number of potential customers.
Of course, the market size must be further analyzed and distilled to arrive at a more accurate figure. But as a “back-of-the-envelope” method, the formula should suffice.
The average revenue per user (ARPU), on the other hand, is an assumption that should be based in accordance with historical precedence and market data on comparable products (or adjacent offerings).
In short, the ARPU must reflect the pricing that customers should be willing to pay, which should be a function of the value delivered to the customer.
Conversely, the revenue metric can be switched with the annual average contract value (ACV), which pertains to the SaaS industry and subscription-based businesses.
If a startup seeks to acquire 10% of a market sized at a $1 billion TAM, that implies a target revenue of approximately $100 million.
- Implied Revenue = 10% Take Rate × $1 billion = $100 million
Market Sizing: How to Analyze TAM
The implied total addressable market (TAM), even if well-thought-out, is simplified calculations at the end of the day. Hence, market sizes are never taken at face value, especially for startups pitching to venture capital (VC) firms.
In fact, the real value of measuring the TAM stems from the basic principle of “knowing your customer”, as part of performing market research.
If a company cannot quantify a range for the TAM of its product offerings (or perhaps did not even attempt to arrive at a ballpark figure), that implies the company does not even know the number of potential customers there are.
Furthermore, a company that does not know how many customers can be obtained, in all likelihood, cannot build a defensible forecast model and share the extracted insights to investors in the process of raising outside capital from institutional investors.
The other benefits of companies calculating their TAM, aside from estimating the total potential revenue,, are as follows:
- Identify New Opportunities for Growth and Market Expansion
- Build Connections to Investors with Aligned Interests (i.e. Venture Capital, Growth Equity, Late-Stage Private Equity)
- Create Sales and Marketing (S&M) Campaigns per Customer Segment (i.e. Targeted Marketing)
Over time, as a byproduct of TAM analysis and the proper implementation of the data, a company should see improved growth from well-defined strategies and better customer retention (i.e. low churn rates).
TAM vs. SAM vs. SOM: What is the Difference?
The TAM, SAM, and SOM represent subsets within a market, with each listed in descending order.
- TAM ➝ “Total Addressable Market”
- SAM ➝ “Serviceable Available Market”
- SOM ➝ “Serviceable Obtainable Market”
1. Total Addressable Market (TAM)
- The total addressable market (TAM) is an all-encompassing, “birds-eye” view of the entire market landscape.
- The total addressable market (TAM) demonstrates the entire revenue opportunity that exists within a particular market segment for a product or service.
- TAM is thereby the maximum amount of revenue that could be generated within a specific market, with the least strict filters applied in terms of counting potential customers.
2. Serviceable Available Market (SAM)
- The serviceable available market (SAM) is the proportion of the TAM that actually needs the company’s products or services.
- The serviceable available market (SAM) carves the TAM into sub-markets that cater towards different types of customer segments.
- From TAM, we start with the largest potential revenue value and then subsequently reduce it using company-specific information and market assumptions to arrive at the SAM.
- The SAM attempts to depict the percentage of the TAM that could realistically become customers someday given their customer profile and need for the company’s offerings and/or the business model (e.g. based on location, pricing tiers, technical capabilities, accessibility).
3. Serviceable Obtainable Market (SOM)
- The serviceable obtainable market (SOM) calculates the current market share of the company to account for the portion of the SAM that can realistically be extended as the market grows.
- The serviceable obtainable market measures the revenue that can realistically be captured by a business in the near-term (or perhaps, long-term).
- The underlying assumption here in the SOM calculation is that the company can retain its current market share in the foreseeable future.
The Wharton Online & Wall Street Prep Applied Value Investing Certificate Program
Learn how institutional investors identify high-potential undervalued stocks. Enrollment is open for the Feb. 10 - Apr. 6 cohort.
Enroll TodayTAM vs. Market Share: What is the Difference
Since it is practically unattainable for a company to be a monopoly in a large market, that means all participants are forced to share the total addressable market (TAM).
Even if a market leader – let’s say, Google in the search engine vertical, for example – gains a new, small competitor, the TAM is regardless technically what is being “split.”
- Market Share ➝The market share refers to the amount of TAM attributable to a specific company.
- Total Addressable Market (TAM) ➝That said, the TAM is the revenue opportunity assuming 100% market share.
TAM Example: Airbnb Market Opportunity
For example, Airbnb (NASDAQ: ABNB) estimated its serviceable addressable market (SAM) to be around $1.5 trillion.
Based on the company’s internal analysis on the travel market and experience economy, Airbnb arrived at a total addressable market (TAM) of $3.4 trillion, which comprises $1.8 trillion for short-term stays, $210 billion for longer-term stays and $1.4 trillion for experiences.
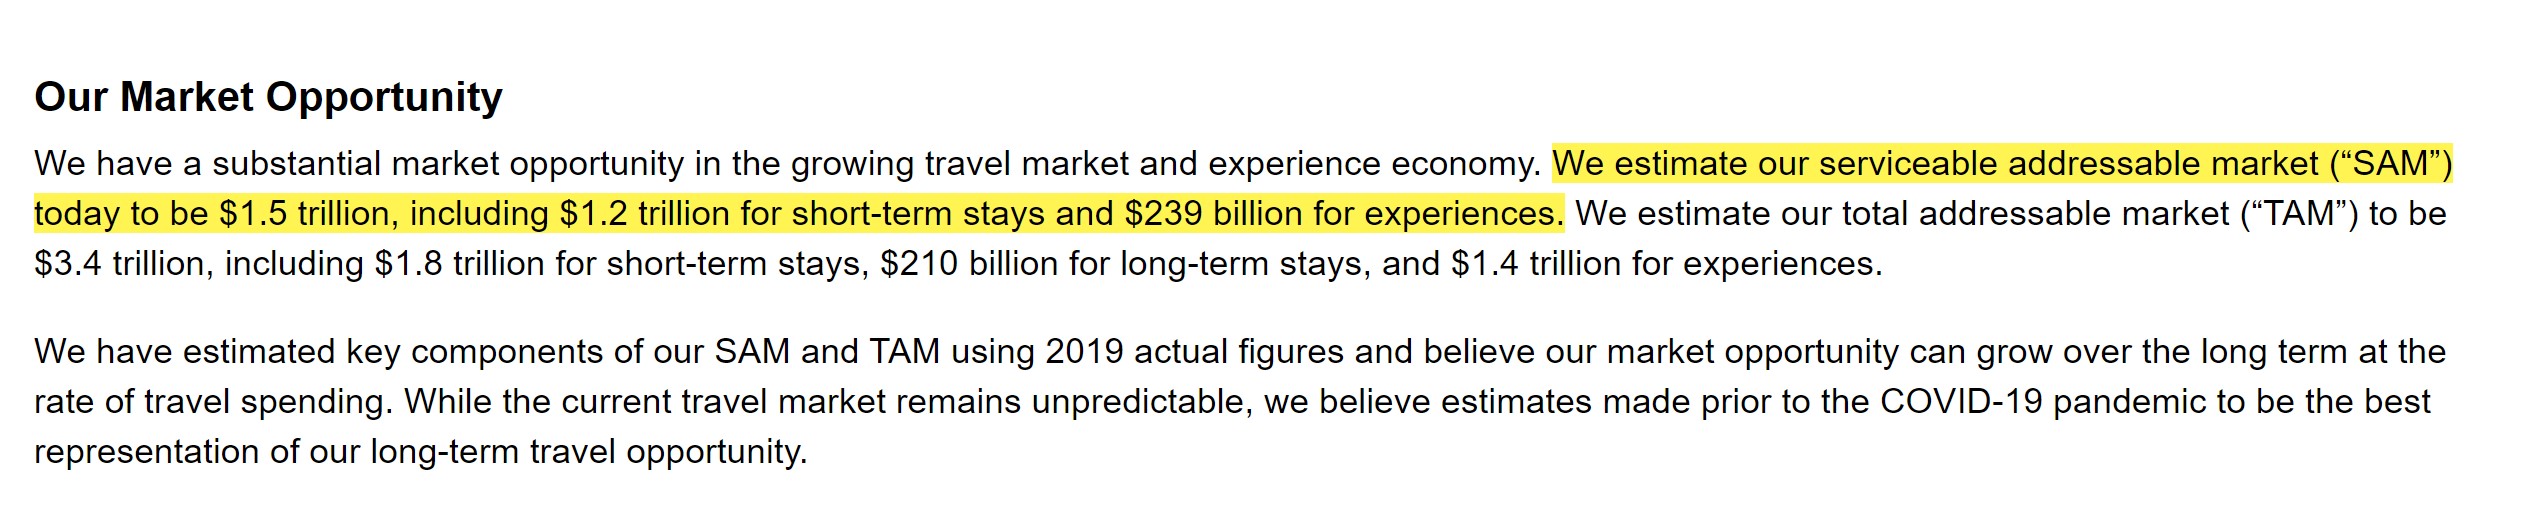 Airbnb Market Opportunity (Source: Airbnb S-1)
Flaws of TAM: Uber IPO Example (Bill Gurley)
The total addressable market (TAM) metric is often criticized for reflecting inflated figures to raise optimism (and capital) from investors, who tend to place minimal weight on the metric.
However, the opposite can also occur, as seen in the case of Uber, one of the leading companies in the modern transportation and delivery services verticals.
Early on, many passed on Uber, with much vocal criticism surrounding its valuation.
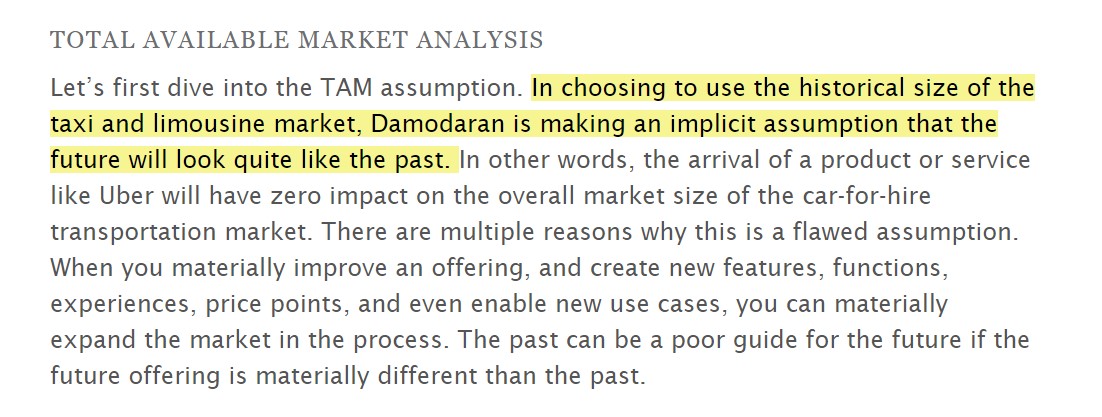
“How to Miss By a Mile: An Alternative Look at Uber’s Potential Market Size” – Bill Gurley (Source: Above The Crowd)
The reason is that many viewed it as just a black car service for affluent consumers – whereas other forward-thinking investors like Gurley considered the capacity for a startup to completely disrupt and create new sub-segments within a market.
Startup Growth Strategy
“The most successful companies make the core progression—to first dominate a specific niche and then scale to adjacent markets—a part of their founding narrative.”
– Peter Thiel, Zero to One
Similar to Uber, many startups nowadays target a specific niche with plans to scale into adjacent markets later on as management continues to improve upon the business model and market strategy.
By establishing a meaningful presence in one niche and then attempting to achieve massive scale across multiple markets, the chance of success is substantially higher than reaching for all markets at once.


