
- What is Times Interest Earned Ratio?
- How to Calculate Times Interest Earned Ratio (TIE)
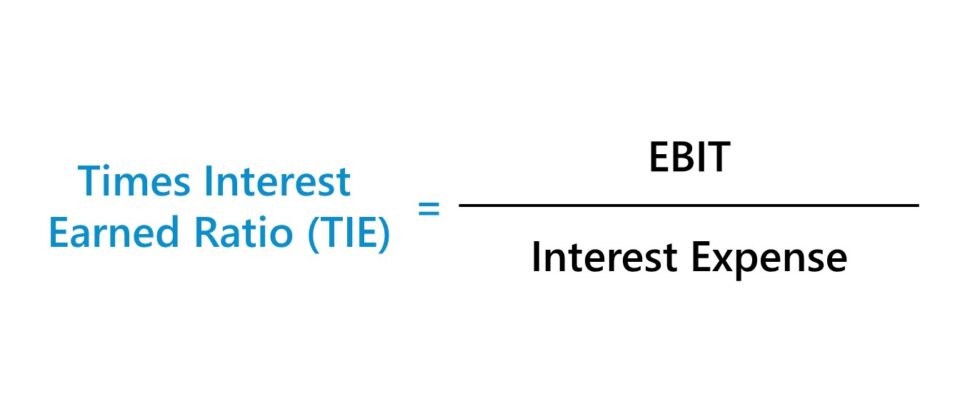
- Times Interest Earned Ratio Formula (TIE)
- What is a Good TIE Ratio?
- Times Interest Earned Ratio Calculator
- 1. Income Statement Assumptions
- 2. Operating Income Calculation (EBIT)
- 3. Times Interest Earned Ratio Calculation Example
What is Times Interest Earned Ratio?
The Times Interest Earned Ratio (TIE) measures a company’s ability to service its interest expense obligations based on its current operating income.
Simply put, the TIE ratio—or “interest coverage ratio”—is a method to analyze the credit risk of a borrower.
As a general rule of thumb, the higher the times interest earned ratio, the more capable the company is at paying off its interest expense on time (and vice versa).
- The times interest earned (TIE) ratio is a financial metric used to analyze a company's capacity to meet its interest burden, calculated by dividing operating income (EBIT) by interest expense.
- The formula for the TIE ratio is EBIT divided by interest expense — albeit some practitioners use EBITDA instead of EBIT, with EBIT being more conservative and commonly used in practice.
- A higher TIE ratio implies more capacity for a company to cover its interest payments, reflecting better creditworthiness and financial stability.
- In contrast, a lower TIE ratio suggests potential financial distress and a higher risk of default.
- A TIE ratio above 2.0x is generally considered acceptable, with 3.0x or higher being preferable — a TIE ratio below 2.0x could signal near-term financial difficulties.
How to Calculate Times Interest Earned Ratio (TIE)
The times interest earned ratio (TIE) compares the operating income (EBIT) of a company relative to the amount of interest expense due on its debt obligations.
- Operating Income (EBIT) ➝ The operating profit of a company, after deducting cost of goods sold (COGS) and operating expenses (SG&A, R&D) from revenue.
- Interest Expense ➝ The cost of borrowing, where the borrower must service periodic interest payments as part of the lending agreement until the debt security reaches maturity (and the principal is repaid in-full).
Conceptually identical to the interest coverage ratio, the TIE ratio formula consists of dividing the company’s EBIT by the total interest expense on all debt securities.
The steps to calculate the times interest earned ratio (TIE) are as follows.
- Step 1 ➝ Calculate Operating Income (EBIT)
- Step 2 ➝ Determine Interest Expense, net
- Step 3 ➝ Divide EBIT by Interest Expense
Times Interest Earned Ratio Formula (TIE)
The formula for calculating the times interest earned ratio (TIE) is EBIT divided by interest expense.
Where:
- EBIT = Gross Profit – Operating Expenses (Opex)
- Interest Expense = Interest Rate (%) × Average Debt Balance
The TIE ratio reflects the number of times that a company could pay off its interest expense using its operating income.
Note, an alternative variation of the TIE ratio uses EBITDA, as opposed to EBIT, in the numerator.
However, EBIT is far more common in practice because the metric is perceived as more conservative, which matters when analyzing credit risk.
What is a Good TIE Ratio?
As a general rule of thumb, the higher the times interest earned ratio (TIE), the better off the company is from a credit risk standpoint.
- Higher TIE Ratio → The company likely has plenty of cash to service its interest payments and can continue to re-invest into its operations to generate consistent profits. If a company has a high TIE ratio, this signifies its creditworthiness as a borrower and the capacity to withstand underperformance due to the ample cushion (to satisfy its debt obligations) provided by its cash flows.
- Lower TIE Ratio → On the other hand, a lower times interest earned ratio means that the company has less room for error and could be at risk of defaulting. Companies with lower TIE ratios tend to have sub-par profit margins and/or have taken on more debt than their cash flows could handle.
While there aren’t necessarily strict parameters that apply to all companies, a TIE ratio above 2.0x is considered to be the minimum acceptable range, with 3.0x+ being preferred.
But once a company’s TIE ratio dips below 2.0x, it could be a cause for concern – especially if it’s well below the historical range, as this potentially points towards more significant issues.
Times Interest Earned Ratio Calculator
We’ll now move on to a modeling exercise, which you can access by filling out the form below.
1. Income Statement Assumptions
In this exercise, we’ll be comparing the net income of a company with vs. without growing interest expense payments.
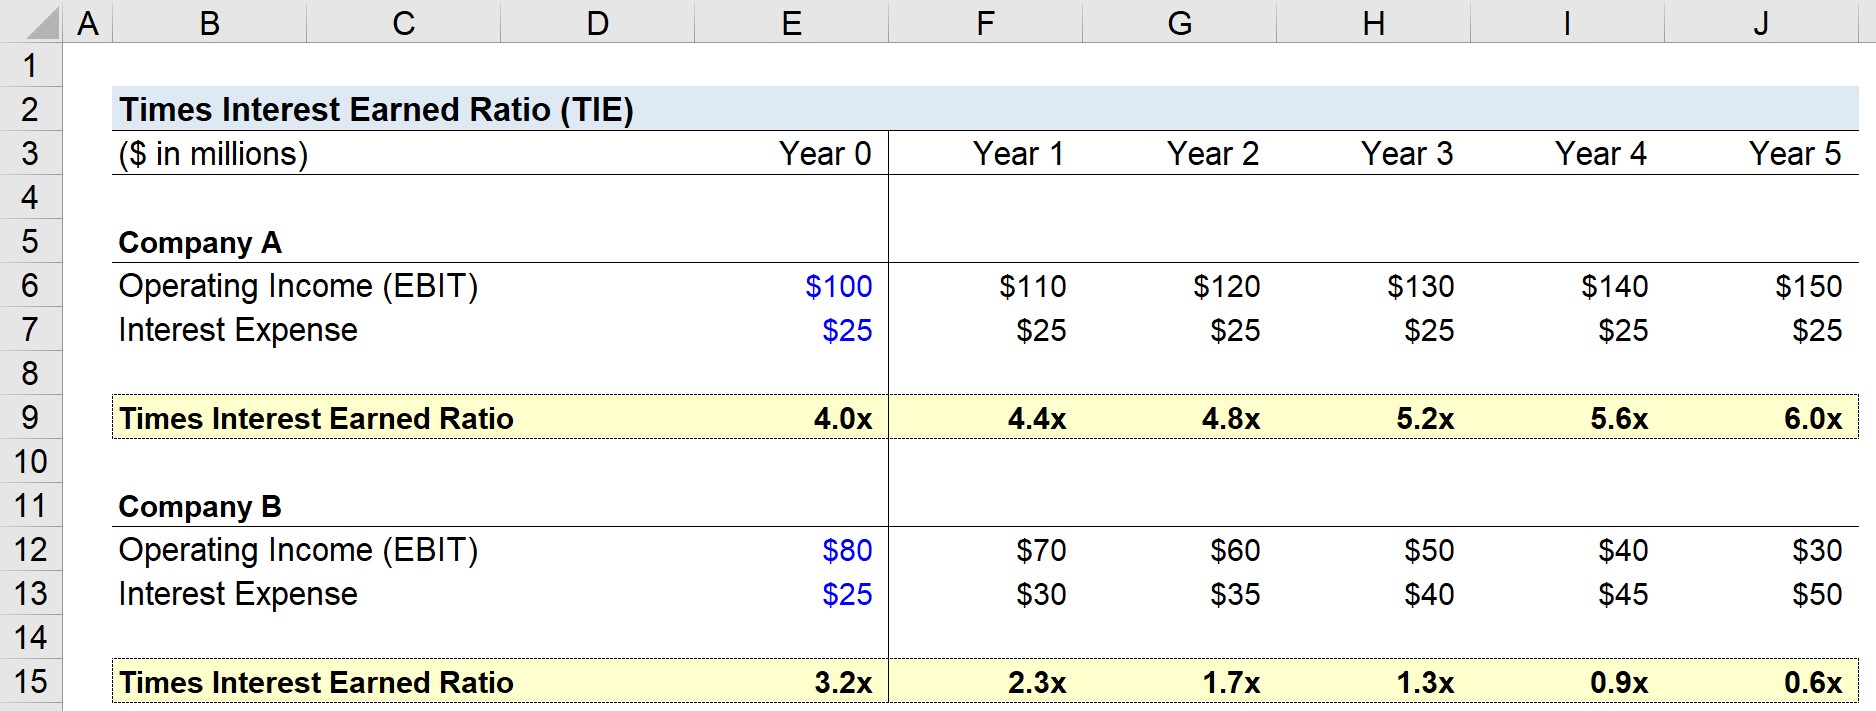
For Company A, we’ll be using the following listed assumptions:
- Operating Income (EBIT) in Year 0 = $100m
- Interest Expense in Year 0 = $25m
- EBIT Growth = $10m / Year
- Interest Expense Growth = $0m
Next, for Company B, we’ll be using the following listed assumptions:
- Operating Income (EBIT) in Year 0 = $80m
- Interest Expense in Year 0 = $25m
- EBIT Growth = – $10m per Year
- Interest Expense Growth = +$5m per Year
2. Operating Income Calculation (EBIT)
Here, Company A is depicting an upside scenario where the operating profit is increasing while interest expense remains constant (i.e. straight-lined) throughout the projection period.
In contrast, Company B shows a downside scenario in which EBIT is falling by $10m annually while interest expense is increasing by $5m each year.
Given the decrease in EBIT, it’d be reasonable to assume that the TIE ratio of Company B is going to deteriorate over time as its interest obligations rise simultaneously with the drop-off in operating performance.
3. Times Interest Earned Ratio Calculation Example
To calculate the times interest earned ratio, we simply take the operating income and divide it by the interest expense.
For example, Company A’s TIE ratio in Year 0 is $100m divided by $25m, which comes out to 4.0x.
- Times Interest Earned Ratio (TIE), Year 0 = $100 million ÷ $25 million = 4.0x
In our completed model, we can see the TIE ratio for Company A increase from 4.0x to 6.0x by the end of Year 5. In contrast, for Company B, the TIE ratio declines from 3.2x to 0.6x in the same time horizon.
In closing, we can compare and see the different trajectories in the times interest earned ratio (TIE).
For a lender deciding whether to provide financing to a potential borrower or not, as well as the terms associated with the lending package if applicable, Company A would be far more likely to receive favorable terms.

Everything You Need To Master Financial Modeling
Enroll in The Premium Package: Learn Financial Statement Modeling, DCF, M&A, LBO and Comps. The same training program used at top investment banks.
Enroll Today


")

