
- What is S&P 500?
- How Does the S&P 500 Index Work?
- SPY Stock: Market Index Fund (ETF)
- S&P 500 Structure: Market Cap-Weighted Index
- What is the SPDR S&P 500 ETF Trust?
- SPX vs. SPY Index: What is the Difference?
- S&P 500 Requirements: Criteria for Inclusion
- SPX Index: Which Companies are in the S&P 500?
- S&P 500 Index (SPY) vs. Dow Jones Index (DJIA): What is the Difference?
- S&P 500 Index (SPY): Sector Breakdown Weightings Chart
- SPY Stock Index: What is the S&P 500 Today?
- S&P 500 Index YTD Price Performance Chart
- What are the Drawbacks to S&P 500 Index ($SPY)?
What is S&P 500?
The S&P 500 is a market-cap weighted stock index constructed to track the share price performance of the top 500 large-cap U.S. equities.
Established in January 1993, the S&P 500 Index is designed to measure the performance of the large-cap, publicly-traded companies in the U.S. equities market, which serves as a “proxy” for the current state of the financial markets, including the broader economy.

How Does the S&P 500 Index Work?
The S&P 500 Index, or “Standard & Poor’s 500 Index”, is a widely recognized barometer of the U.S. public equities market and the broader economy.
The S&P 500 is a stock market index composed of ~500 of the leading publicly-traded companies.
Hence, the S&P is frequently used as a benchmark (“hurdle rate”) for investors to attain excess returns over, e.g. hedge funds often compare their returns to the S&P 500’s return to assess their relative performance.
S&P 500 Index Characteristics
- Weighting Method → Float-Adjusted Market Cap Weighted
- Rebalancing Frequency → Quarterly Basis (March, June, September, and December)
- Index Launch Date: Mar 04, 1957
- Number of Constituents → 503 Companies
The current state and recent performance of the U.S. financial markets are often analyzed using the S&P 500 index as a proxy to understand the prevailing economic conditions and near-term outlook.
Constructed on a market capitalization-weighted basis, the S&P 500 index designates a percent weight to each constituent based on the value of its equity – otherwise known as their market capitalization (or “market cap”).
Learn More → S&P 500 Index Methodology Factsheet (Source: S&P 500)
SPY Stock: Market Index Fund (ETF)
The SPDR S&P 500 ETF Trust, which trades under the ticker symbol “SPY”, is a float-adjusted market capitalization weighted index.
In a capitalization-weighted index – such as the S&P 500 (SPY) – each constituent is weighed relative to the collective total market capitalization of all parties, which causes the distribution of influence to be distorted.
The composition of the S&P 500 index is determined by a committee based on stringent criteria, including their market value of equity, liquidity (i.e. cash on hand), and ensuring fair representation of all industries (or sectors) in the markets.
The S&P 500 is widely regarded as the leading gauge for the performance of large-cap U.S. equities, which is the reason for its common use in intrinsic value techniques, namely the discounted cash flow (DCF) model, i.e. the terminal value growth rate.
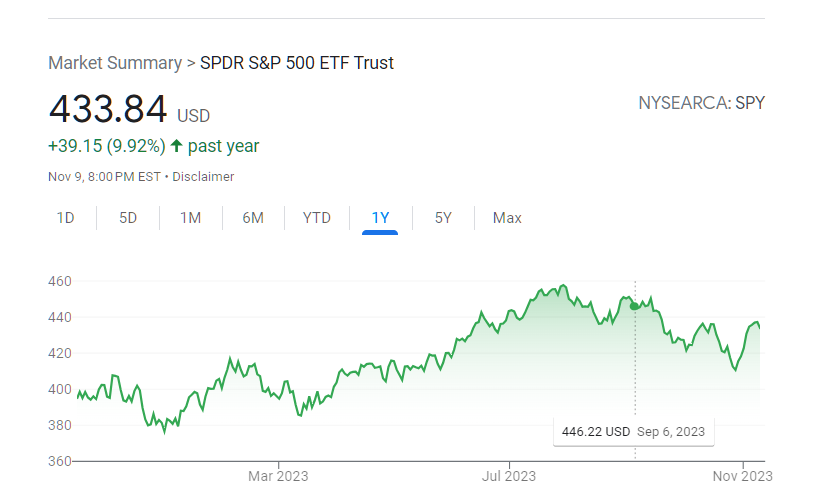
SPY Stock Price on November 9, 2023 (Source: Google Finance)
S&P 500 Structure: Market Cap-Weighted Index
The S&P Index 500 index is structured as a capitalization-weighted index, or “market cap weighted index”, where the individual constituents that comprise the index have a percent contribution based on their total market capitalization, i.e. equity market.
The S&P 500’s value is calculated based on the market cap of each company, which is equal to the share price of the company multiplied by the total number of shares outstanding.
The share count is adjusted to consider only the shares available to be traded in the open markets.
Since market capitalization is adjusted for the shares available for trading, the S&P is considered a float-weighted index – i.e. it accounts for only the shares that can actually be traded in the market.
Each company in the S&P 500 index is weighted differently based on their respective market capitalization, which can be calculated by dividing the company’s market cap by the total market cap of the S&P 500.
Therefore, companies with larger market caps are weighted more heavily – meaning their positive/negative share price movements are much more impactful on the broader index.
The Wharton Online & Wall Street Prep Applied Value Investing Certificate Program
Learn how institutional investors identify high-potential undervalued stocks. Enrollment is open for the Feb. 10 - Apr. 6 cohort.
Enroll TodayWhat is the SPDR S&P 500 ETF Trust?
The SPDR S&P 500 ETF is an exchange-traded fund (ETF) that trades in the open markets under the ticker symbol “SPY”.
The SPDR S&P 500 ETF (SPY) is one of the oldest, long-standing ETFs managed by State Street Global Advisors.
In short, the SPDR S&P 500 ETF was designed to replicate the risk-adjusted returns of the S&P 500 Index.
Therefore, the investors in the SPDR ETF benefit from portfolio diversification from the broad exposure inherent to the S&P 500 index.
Since the SPY ETF is publicly-traded, institutional and retail investors purchase and sell shares throughout trading days, as the price fluctuates based on the markets (i.e. supply-demand).
But the diversified portfolio of the SPY ETF deliberately balances the weighting structure of the portfolio in accordance with the S&P 500 index to replicate its returns with exposure to all sorts of sectors.
Given the risk mitigation via portfolio diversification, the reputability and recognition of the SPDR S&P 500 ETF (SPY) – including its market-leading assets under management (AUM) of $401,562.81mm
as of November 2, 2023 – is understandably a reasonable option for individual and institutional investors alike.
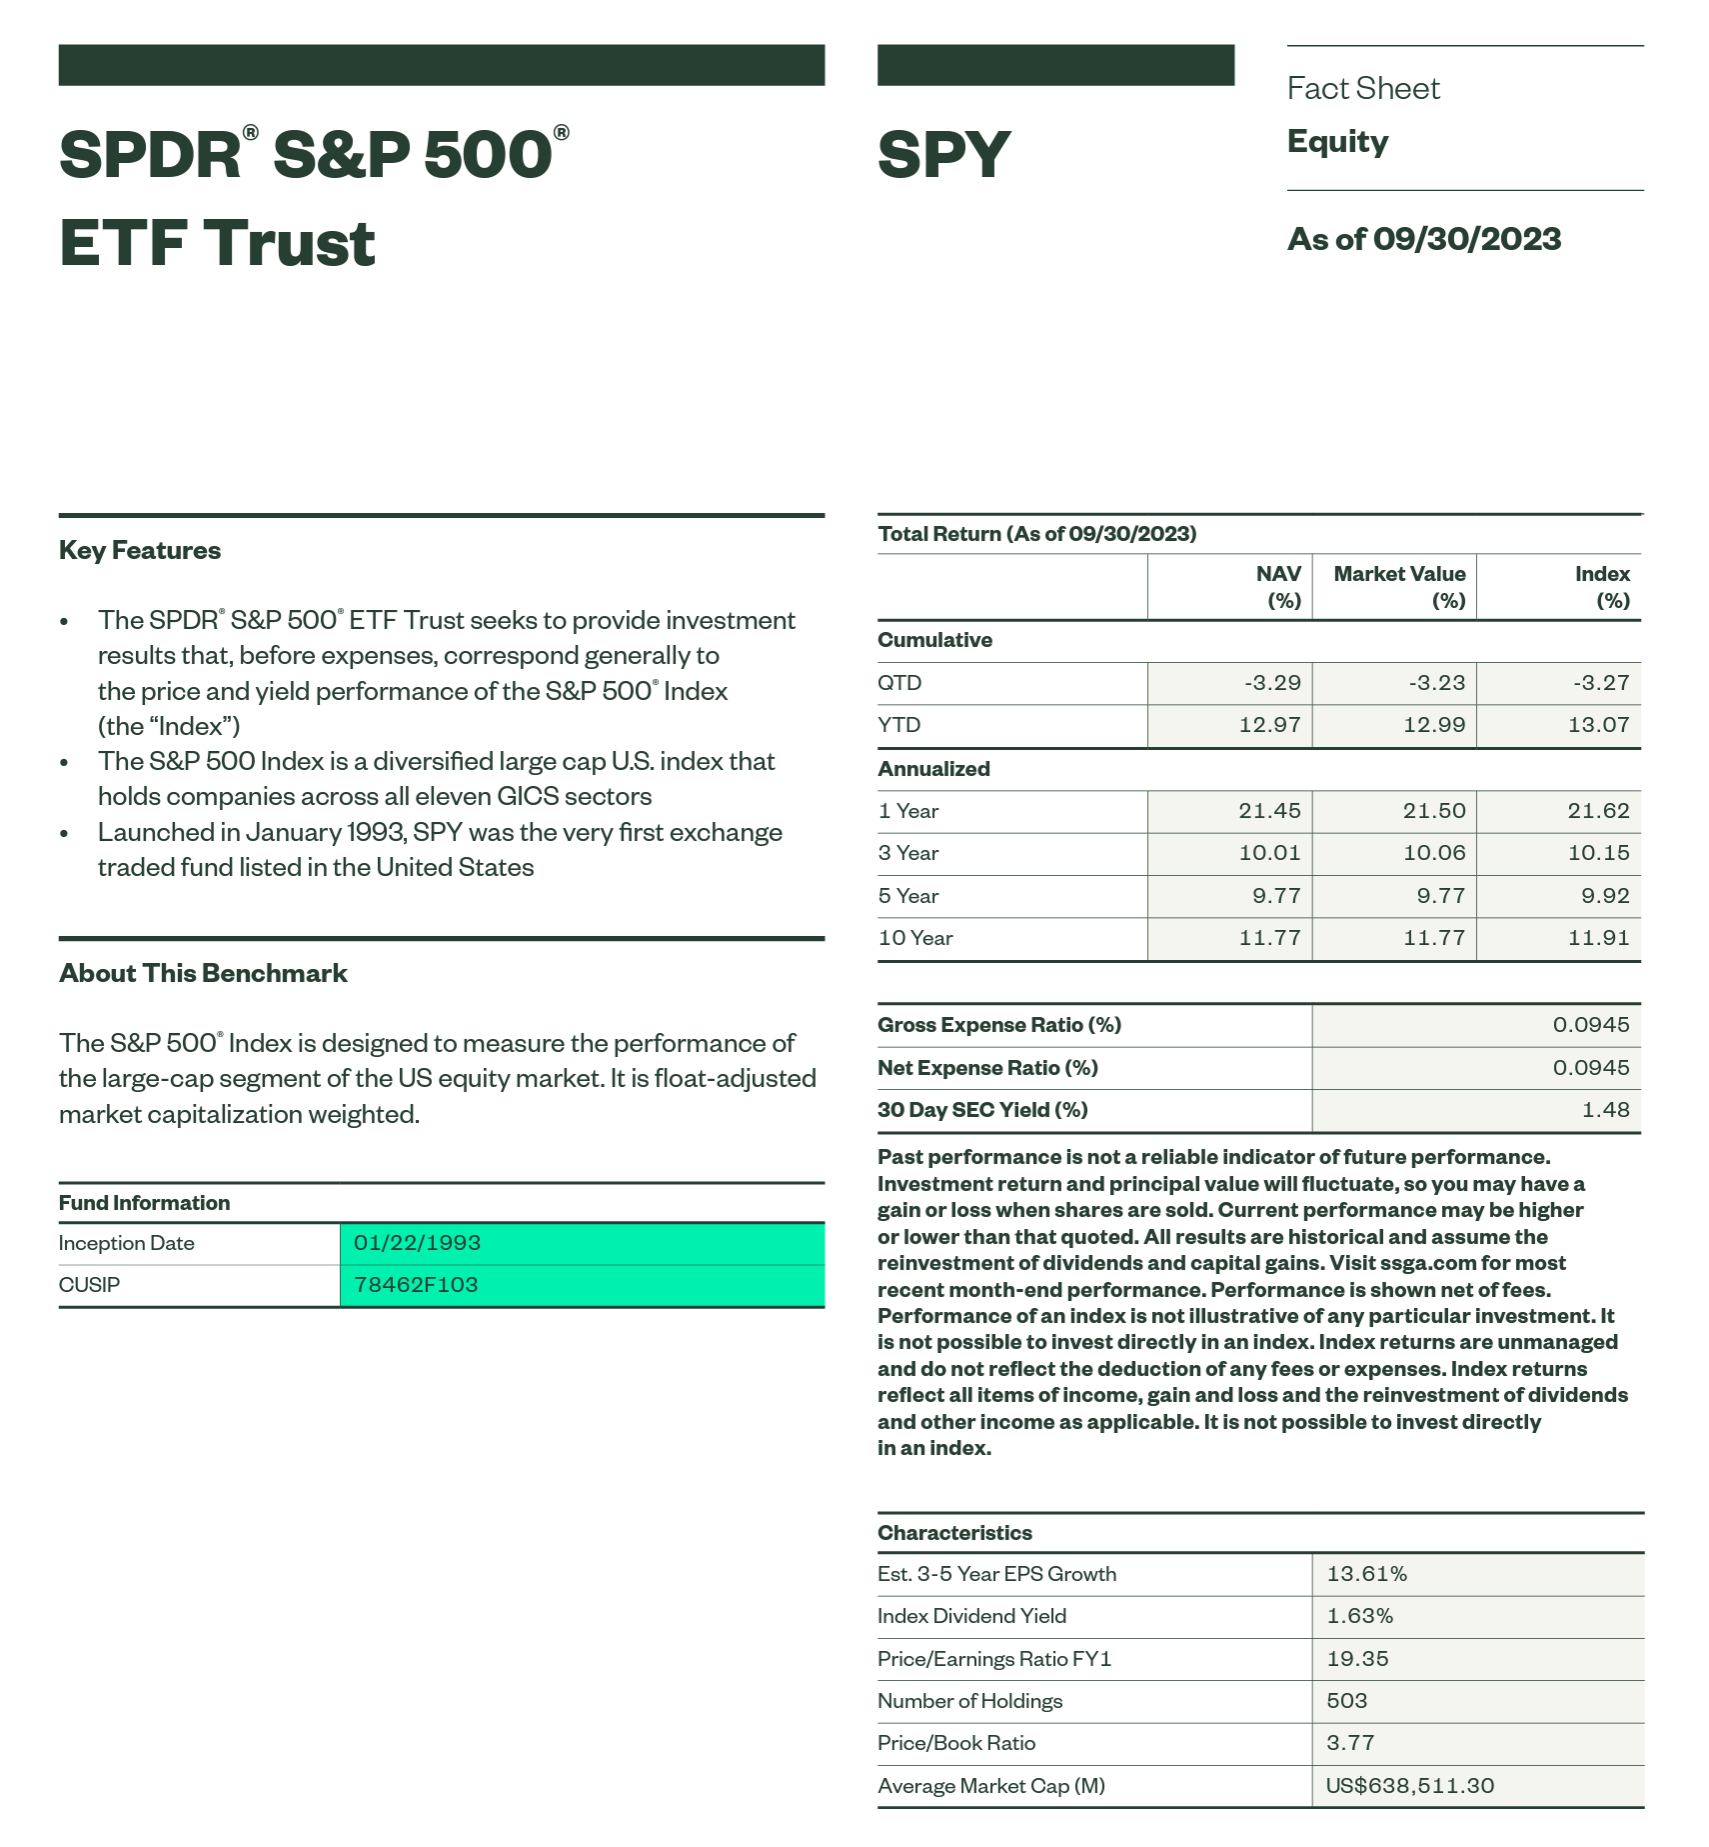
SPDR S&P 500 ETF Trust FactSheet (Source: State Street SPDR)
SPX vs. SPY Index: What is the Difference?
- Standard & Poor’s 500 Index ($SPX) → The S&P 500 Index, commonly referred to as SPX, reflects the performance of ~500 leading publicly-traded U.S. companies. The selection of the companies are based on their market capitalization (“market cap”). The distinction between SPX and SPY lies in their tradability because SPX by itself is a theoretical index and thus not directly traded in the open markets. In other words, investors cannot purchase and sell shares of SPX.
- SPDR S&P 500 ETF Trust ($SPY) → In contrast, the SPDR S&P 500 ETF Trust ($SPY) is an exchange-traded fund designed to track the performance of the S&P 500 Index. The portfolio of SPY consists of the same stocks (and weights) as the S&P 500 index to track the index’s performance. Unlike the SPX index, SPY holds actual stocks and therefore distributes shareholder dividends, which are derived from the dividend issuances of the underlying stocks within the portfolio. SPY is traded openly on stock exchanges, alike individual public equities, contrary to SPX.
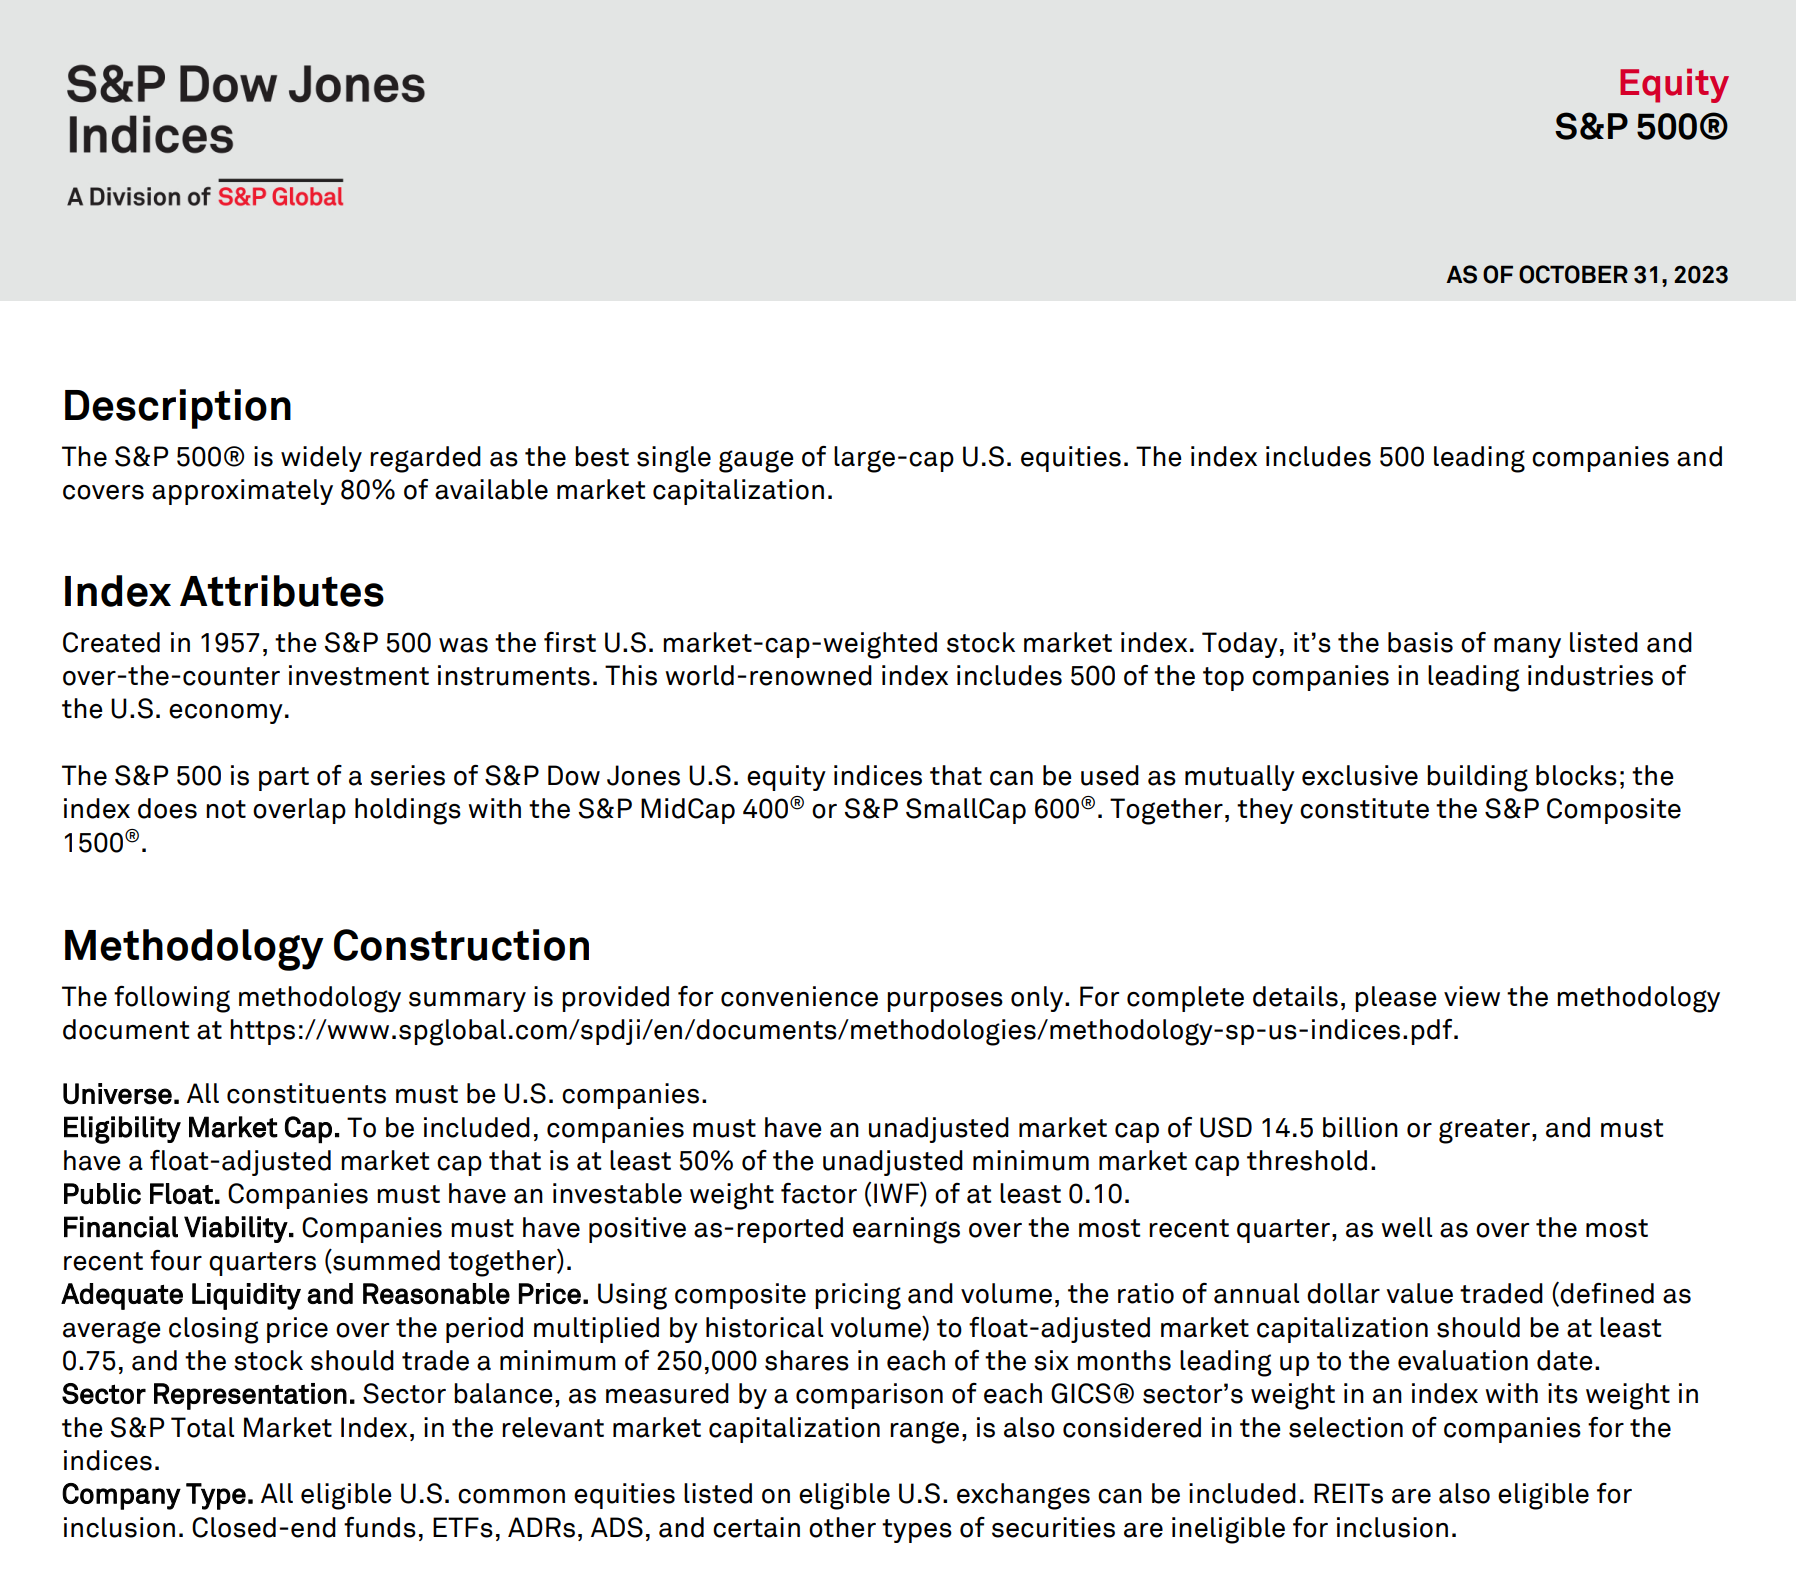
S&P 500 Requirements: Criteria for Inclusion
To be eligible for inclusion in the S&P 500 index, the following criteria must be met:
- Minimum Market Capitalization of $8.2 billion
- Structured as Corporation Based in the U.S. with Common Stock in Capitalization
- Listed on an Eligible U.S. Exchange (e.g. NYSE, NASDAQ)
- Positive Reported Earnings in the Most Recent Quarter and on a Trailing Twelve Months (TTM) basis – i.e. the Sum of the Most Recent Historical Four Quarters
Only the U.S.’s largest corporations with stable performance can be added to the S&P 500, and the list is reviewed and updated on a quarterly basis.
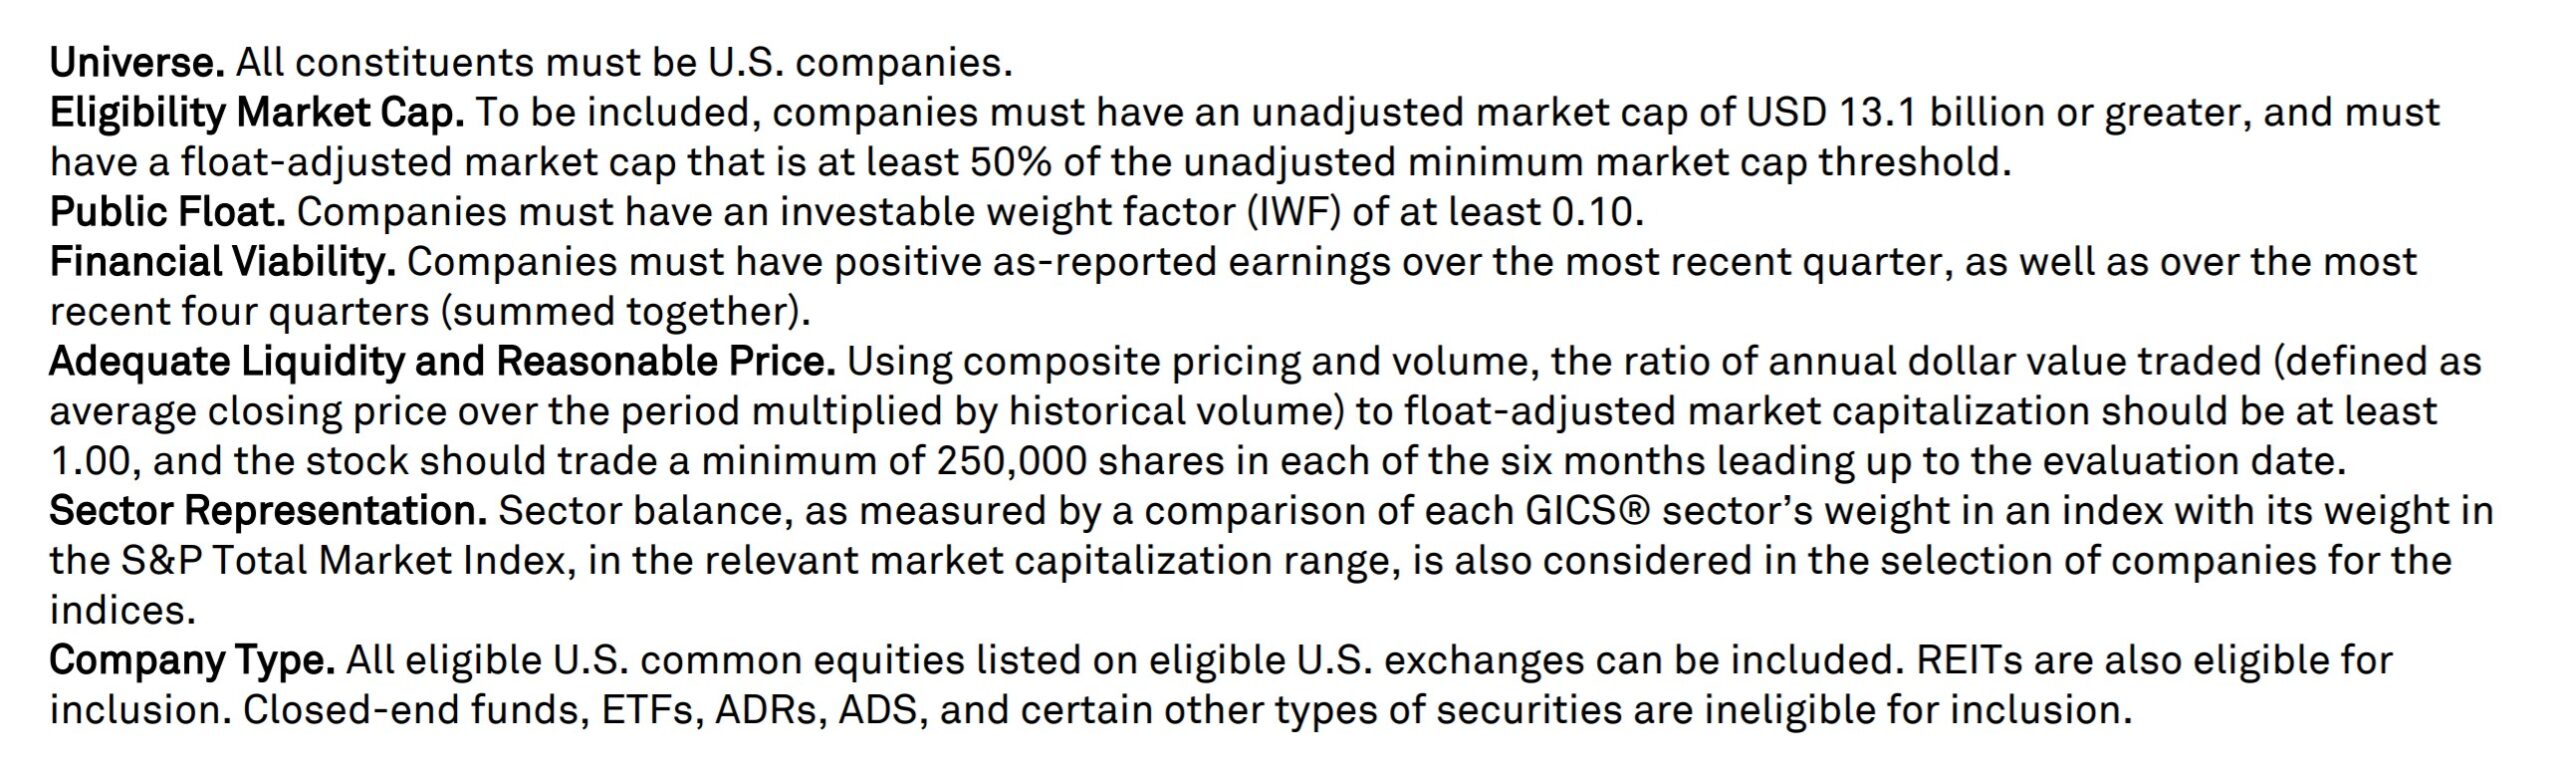
S&P 500 Eligibility Requirements (Source: S&P Global)
Learn More → S&P U.S. Indices Methodology
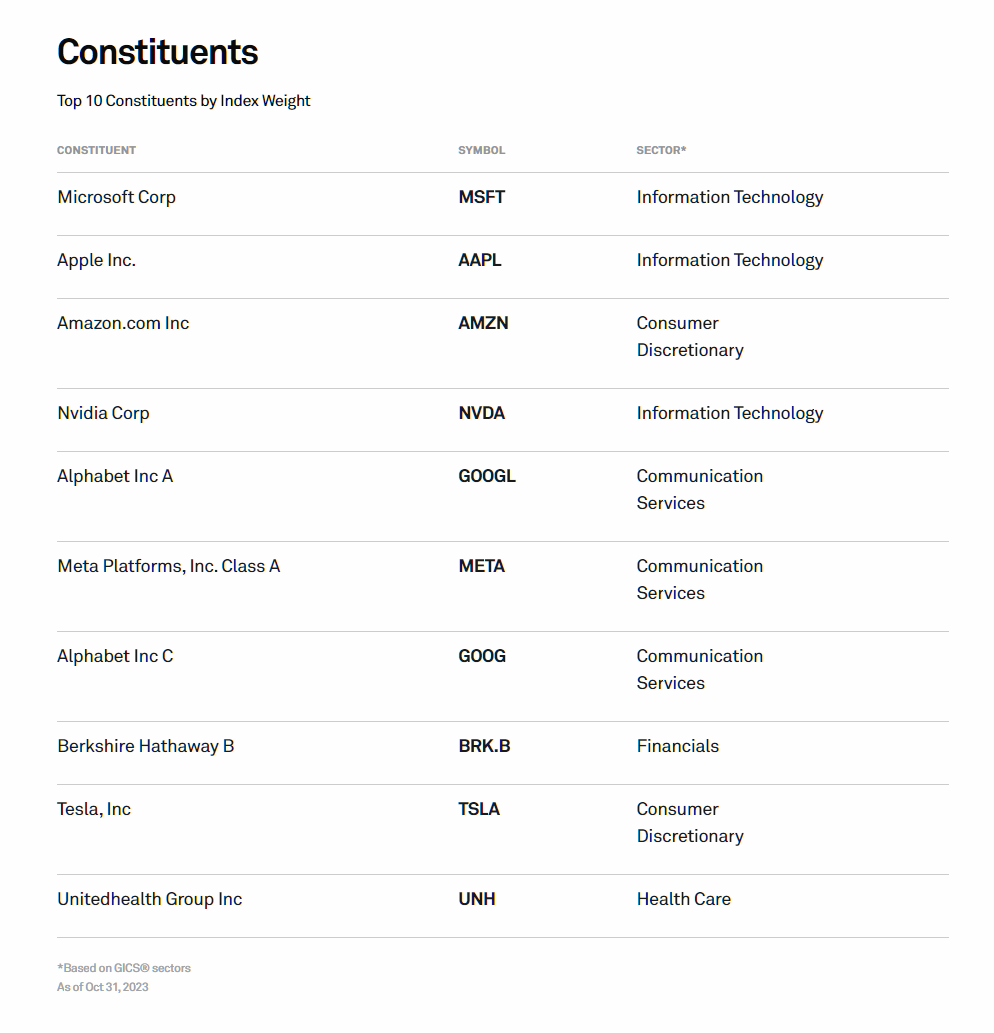
SPX Index: Which Companies are in the S&P 500?
The table below lists the top ten constituents of the S&P 500 based on index weight:
| Company Name | Ticker Symbol |
| Apple |
|
| Microsoft |
|
| Amazon |
|
| Tesla |
|
| Alphabet (Class A) |
|
| Nvidia |
|
| Alphabet (Class C) |
|
| Meta Platforms (Formerly Facebook) |
|
| Berkshire Hathaway (Class B) |
|
| JP Morgan Chase & Co. |
|
S&P 500 Index (SPY) vs. Dow Jones Index (DJIA): What is the Difference?
The purpose of the S&P 500, akin to the other well-recognized stock market indices – e.g. the Dow Jones Industrial Average and Nasdaq Composite – is to measure the performance of the broader stock market (and U.S. economy).
The Dow Jones Industrial Average (DJIA), or the “Dow,” is another prevalent market index consisting of large, established companies.
The difference between the S&P 500 Index and the DJIA Index are as follows:
- Standard and Poor’s 500 (S&P 500 Index) → The S&P 500 index, to reiterate from earlier, uses a market capitalization-weighted approach, where the mechanism to compute the index value relies on the total market capitalization (or “market cap”) of all constituents. However, the market-cap weighted approach causes certain companies with higher valuations to have a disproportionate impact on the index value. In terms of commonalities, the two indices each incorporate a divisor – to adjust for corporate actions, such as stock splits and reverse splits – to maintain consistency in the index value, and to reduce the risk of investors incurring losses from a lack of transparency, especially on the retail side. The DJIA index is share price-weighted, as opposed to market cap-weighted like the S&P 500 index, which means companies with higher share prices hold greater weight.
- Dow Jones Industrial Average (DJIA Index) → In contrast, the computation methodology of the DJIA index is distinct from the S&P 500 index because the structure is price-weighted, whereby the index level is determined by the aggregate stock prices of its thirty constituents. The contribution of each constituent is directly proportional to its share price (and the variance in market pricing is reflected in the value of the DJIA index). The DJIA index consists of merely 30 companies, considered market leaders in their respective industries.
Unlike the S&P 500 index, the value of the DJIA index is calculated using the following steps:
- Adding the Share Prices of all 30 Companies in the DJIA Index
- Adjusting for the Weighting of Each Company (Price-Weighted Structure)
- Dividing by the Dow Divisor (i.e. Adjustment Factor)
In conclusion, the S&P 500 index and the Dow Jones Industrial Average (DJIA) are nevertheless two of the most commonly tracked indices of U.S. equities.
S&P 500 Index (SPY): Sector Breakdown Weightings Chart
The information technology (IT) sector is the most significant contributor to the S&P 500 index.
The graph below shows the percentage contribution by sector:
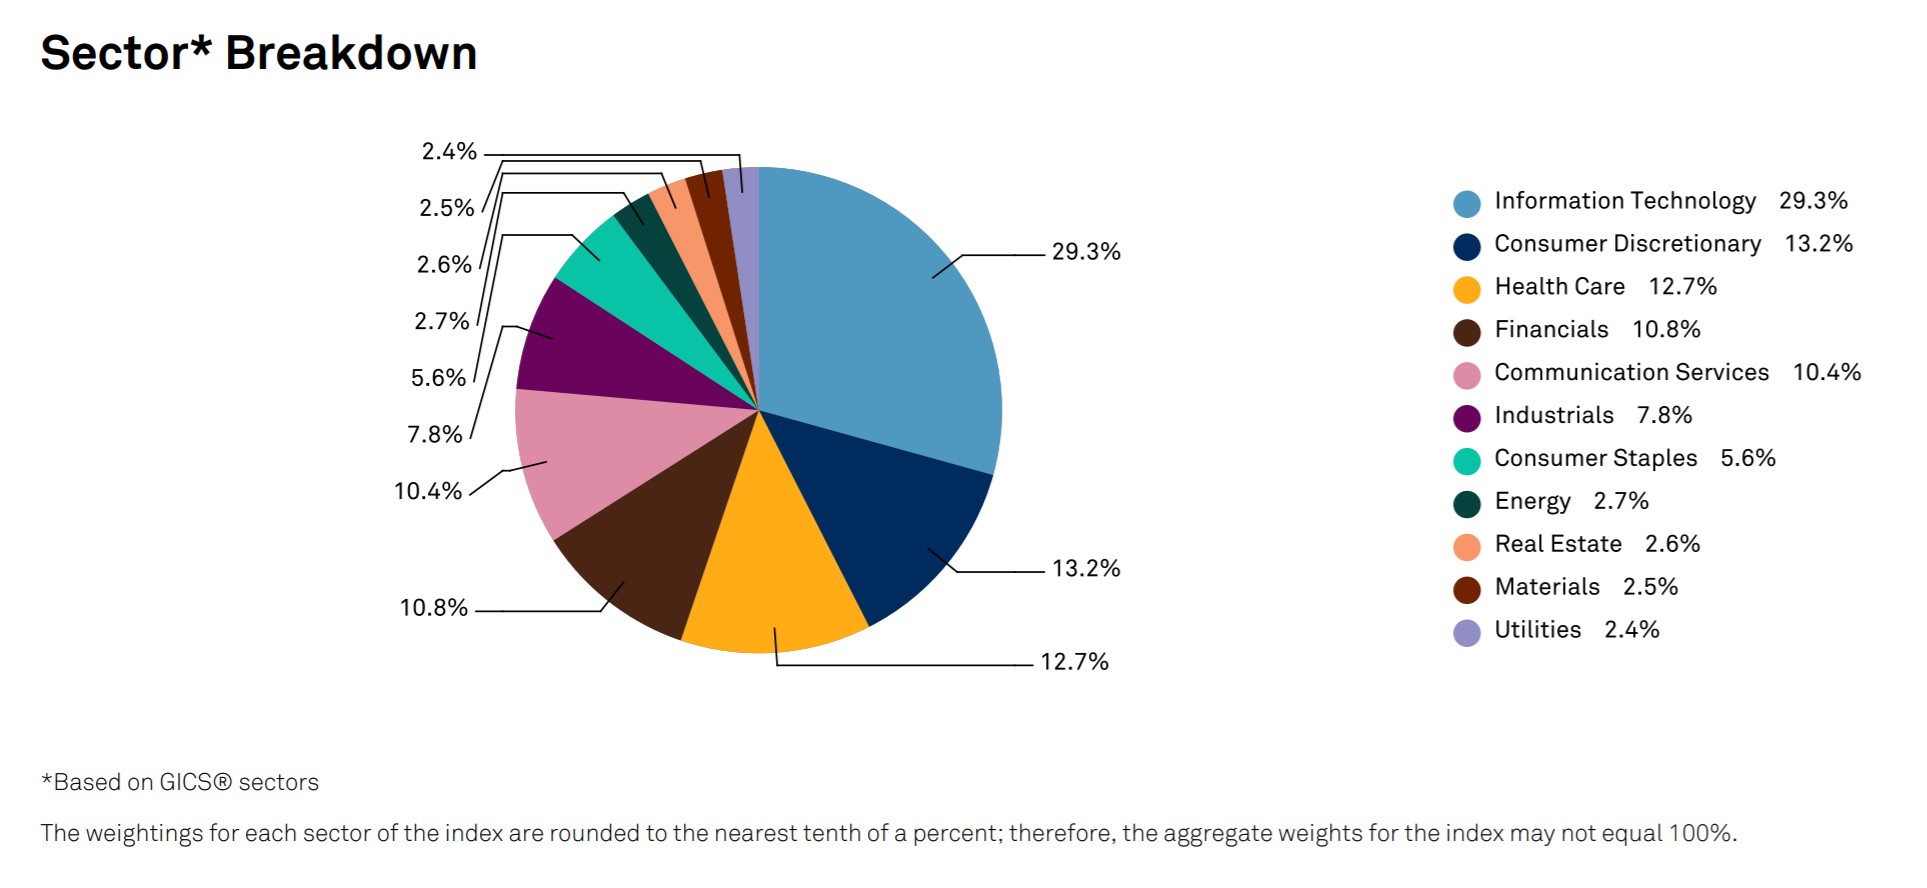
S&P 500 Sector Break-Down (Source: S&P Fact Sheet)
SPY Stock Index: What is the S&P 500 Today?
Checking the daily performance of the S&P 500, assuming it is a trading day in which the financial markets are open, can be easily done from any of the following resources:
S&P 500 Index YTD Price Performance Chart
According to S&P Global, the year to date (YTD) performance of the S&P 500 stock market index is up 13.5% YTD as of November 9, 2023.
The chart below reflects the year to date (YTD) performance of the S&P for 2023.
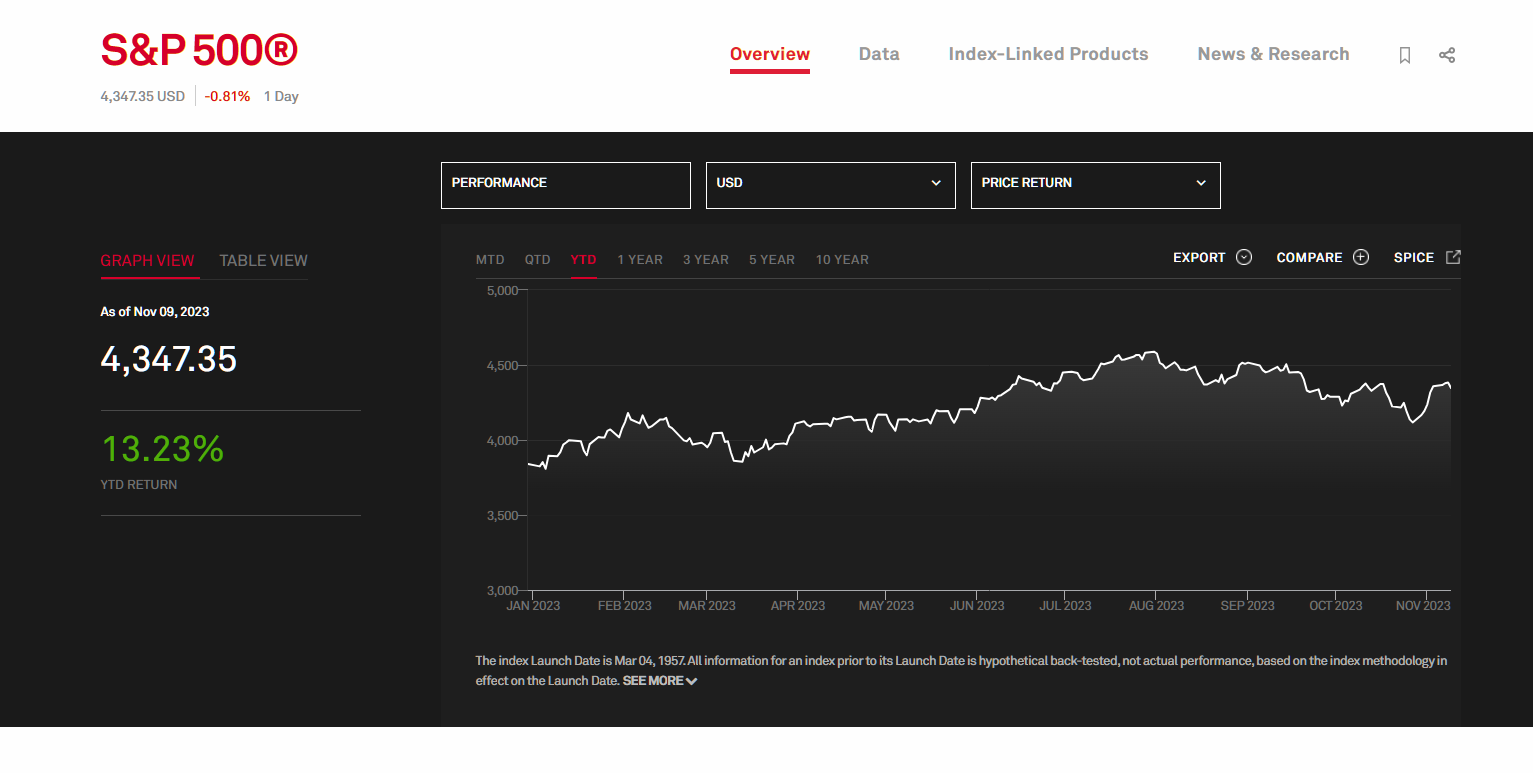
S&P 500 Year-to-Date Performance as of Dec. 16, 2021 (Source: S&P Global)
What are the Drawbacks to S&P 500 Index ($SPY)?
Following the initial break-out of COVID-19 in 2020, the stock market recovered and performed far better than most expected.
There are several potential reasons for this reaction – e.g. the risk-free rate for equities (US 10-year Treasury notes) yielded around 0.6% to 0.8%, so many institutional investors still opted to invest in large-cap companies unlikely to default.
In particular, the strong performance of the “FAANG” stocks disproportionately exceeded the market, as these companies led the S&P 500’s swift recovery.
- Facebook (Meta Platforms)
- Amazon
- Apple
- Netflix
- Google (Alphabet)
Considering their weighting in the S&P 500 Index, the market surpassed record all-time highs later in 2020 despite the economic turmoil and record unemployment.
The scenario above illustrates the main drawback to the S&P 500 – which is that the strong performance of a select few companies can uphold the index.
Not to mention, these companies are frequently criticized for being overvalued – e.g. Amazon (AMZN), Apple (AAPL), and Tesla (TSLA).
It is argued that the S&P index is far too concentrated on leading high-market cap companies and prone to artificial inflation, as opposed to accurately representing the total market performance as intended.
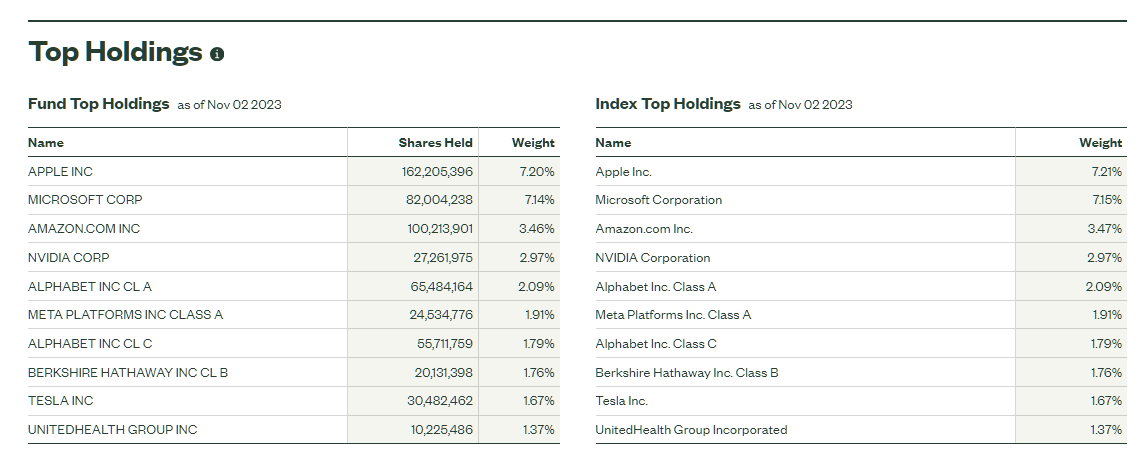
SPDR Fund Top Holdings as of November 2, 2023 (Source: State Street SPDR)


This is very important and educational experience for me thank you