
- What are Sources and Uses?
- How to Calculate Sources and Uses of Funds
- Why Does the Sources and Uses Matter in an LBO?
- What is the Uses of Funds Side?
- What is the Sources of Funds Side?
- Sources and Uses of Funds Calculator | Excel Template
- 1. LBO Transaction Assumptions
- 2. LBO Financing Assumptions
- 3. LBO Sources of Funds Calculation Example
- 4. LBO Rollover Equity and Sponsor Equity Calculation
- 5. Sources and Uses Model Example
What are Sources and Uses?
The Sources and Uses of Funds is a table summarizing the total amount of funding required to complete an M&A transaction, such as a leveraged buyout (LBO).
How to Calculate Sources and Uses of Funds
Under the specific context of a leveraged buyout (LBO), the sources and uses of funds table lists the total cost of acquiring the target in a hypothetical transaction structure.
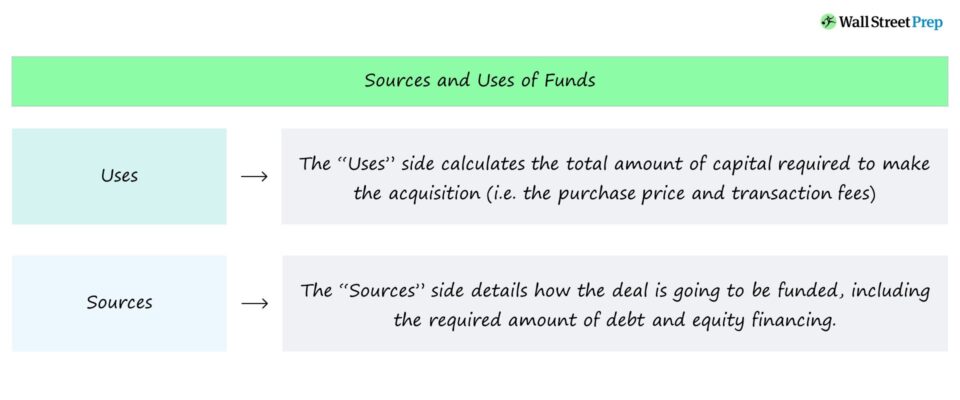
- Uses → The “Uses” side calculates the total amount of capital required to make the acquisition (i.e. the purchase price and transaction fees).
- Sources → The “Sources” side details how exactly the deal is going to be funded, including the required amount of debt and equity financing.
One of the main purposes of a LBO model is to evaluate how much an initial equity investment by a sponsor has grown, therefore we must evaluate the necessary initial equity contribution from the sponsor.
The proposed capital structure is among the most important return drivers in a LBO, and the investor usually has the role of “plugging” (i.e. with equity) the remaining gap between the sources and uses for the transaction to proceed and close.
Just like how the assets side must be equal to the liabilities and equity side on the balance sheet, the “sources” side (i.e. the total funding) must be equal to the “uses” side (i.e. the total amount being spent).
Why Does the Sources and Uses Matter in an LBO?
From the perspective of the buyer in a LBO – most often financial sponsors (i.e., private equity firms) – one of the purposes of the sources & uses table is to derive the amount of equity that must be contributed towards the deal.
All else being equal, the less equity contributed by the PE firm, the higher the returns to the fund (and vice versa).
The returns to the investor are a direct function of the amount of equity required. Hence, the required equity contribution is among one of the most important considerations when deciding whether to proceed or pass on an investment opportunity.
Financial sponsors are incentivized to minimize the amount of cash equity required by limiting the purchase price and utilizing as much debt as possible to fund the deal – all while not placing an unmanageable level of risk onto the target company.
The Wharton Online and Wall Street Prep Private Equity Certificate Program
Level up your career with the world's most recognized private equity investing program. Enrollment is open for the Feb. 10 - Apr. 6 cohort.
Enroll TodayWhat is the Uses of Funds Side?
To begin, we recommended starting on the “Uses” side before completing the “Sources” side, as intuitively, you’d need to quantify how much something costs before thinking about how you’ll come up with the funds to pay for it in the first place.
The main cash outlay for all LBOs is going to be the purchase price (i.e., the total cost of acquiring the company). Here, the first step is to figure out the entry multiple and the appropriate financial metric.
For the vast majority of deals, EBITDA tends to be the metric that is used to determine the bid (purchase price), and this metric will either be on a last twelve months (LTM) or next twelve months (NTM) basis. By multiplying the entry multiple by the relevant financial metric, the purchase price can be calculated.
Besides the purchase price, the uses section also consists of the following two fees categories:
- Transaction Fees → Costs associated with M&A advisory and legal expenses – with such fees typically estimated by multiplying the purchase enterprise value by a transaction fee percentage assumption (i.e. 2%) until more data is available to adjust accordingly
- Financing Fees → Oftentimes called debt issuance costs, these are the payments to the 3rd parties involved in arranging the debt financing (i.e. administrative fees as charged by the lender, lender legal costs)
Transaction fees are expensed immediately upon transaction close whereas financing fees are capitalized on the balance sheet and amortized over the maturity of the debt despite the payments occurring upfront.
The “Cash to B/S” line item refers to the estimated amount of cash required to be on the balance sheet of the company upon the date of transaction close. The minimum cash balance must take into account the cash required by the acquired company to continue operating day-to-day without needing any external financing to fund its working capital requirements.
What is the Sources of Funds Side?
On the other side of the table, we have the sources of capital, which represent where the funding for the transaction comes from.
The amount of debt used will normally be calculated as a multiple of EBITDA, while the amount of equity contributed by the private equity investor will be the remaining amount required to close the gap for both sides to balance.
The total leverage multiple will depend on the target company’s fundamentals such as the industry it operates within, competitive landscape, and historical trends (e.g., cyclicality, seasonality).
When determining how much debt capacity a company has, investor judgment is required to gauge the amount of debt the company could handle – in addition to preliminary discussions with potential lenders, with whom there are typically pre-existing relationships and/or past experiences working together with the investor.
Other nuances such as management rollover are also going to show up in this section. In short, management rollover is when the prior management team uses their equity (i.e., their stake of the pre-LBO company and exit proceeds from the sale) to help fund the transaction.
Management rollover is usually perceived as a positive sign because it shows that management believes in the company’s ability to implement its growth strategy and its future trajectory.
To calculate the rollover amount, the total buyout equity value and the total pro forma ownership % that will be rolled over must be determined.
In absence of sufficient data, the rollover amount can be roughly approximated by multiplying the rollover % assumption by the total equity required.
Sources and Uses of Funds Calculator | Excel Template
We’ll now move to a modeling exercise, which you can access by filling out the form below.
1. LBO Transaction Assumptions
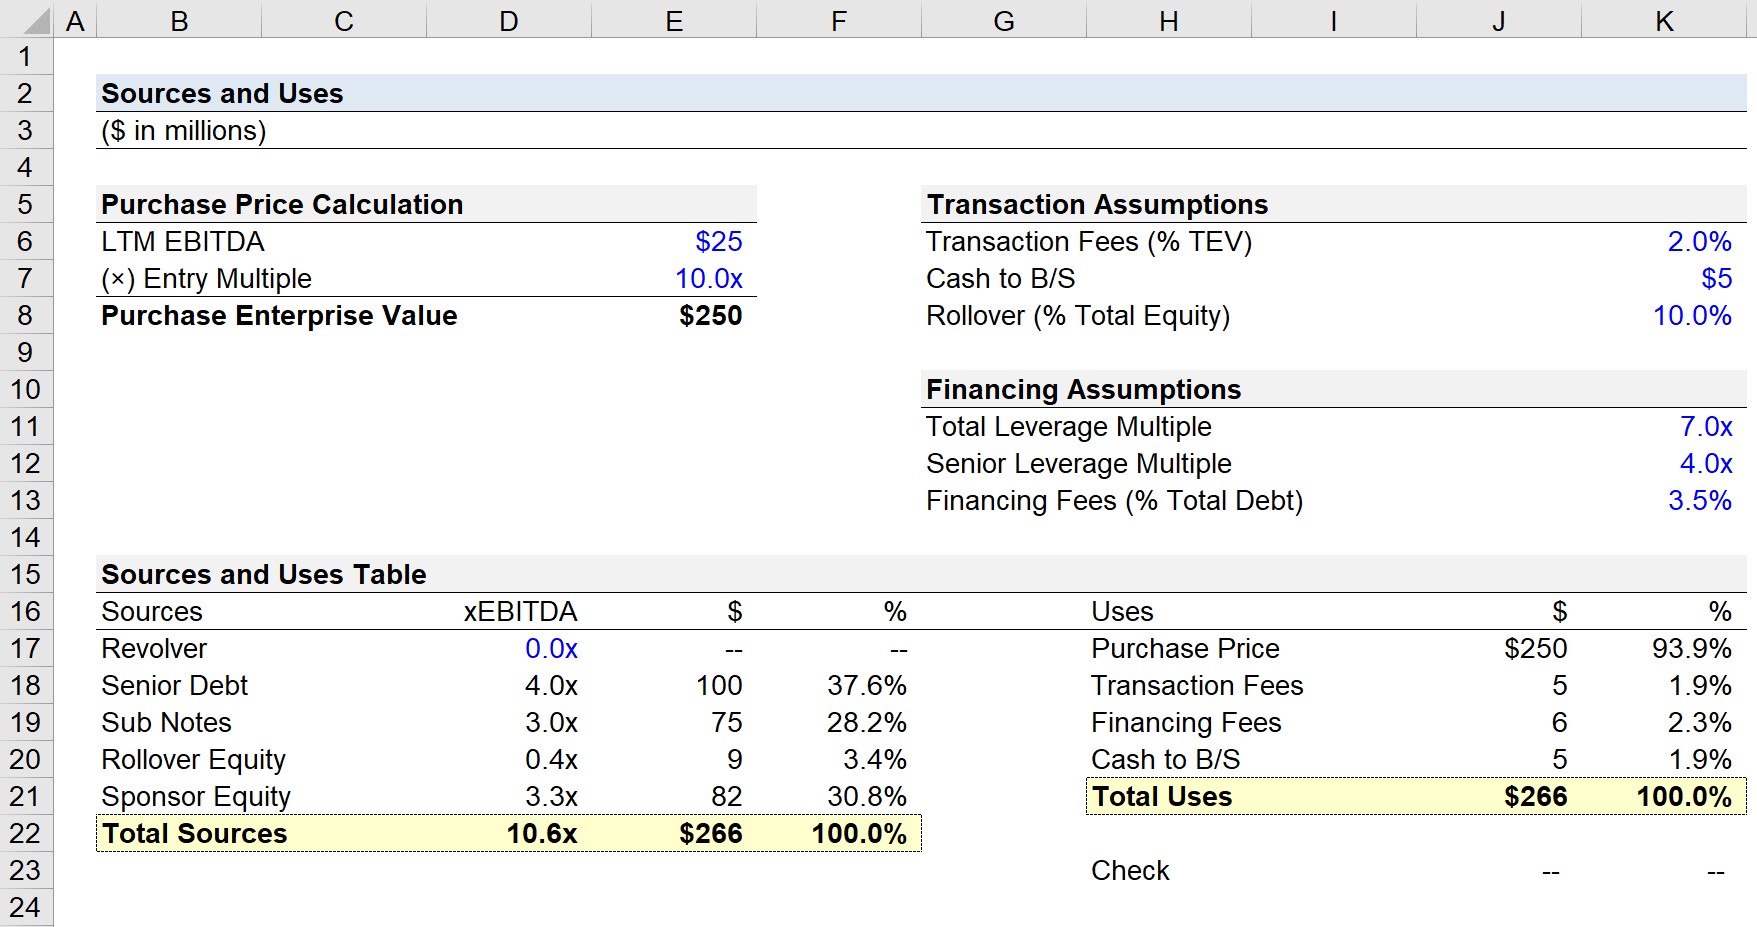
In the first step, we’ll calculate the purchase price by multiplying the LTM EBITDA by the entry multiple assumption, which in this case comes out to $250mm ($25mm LTM EBITDA × 10.0x Entry Multiple).
- LTM EBITDA = $25 million
- Entry Multiple = 10.0x
- Total Enterprise Value (TEV) = $25 million × 10.0x = $250 million
Here, we’ll use the total enterprise value (TEV) because we’re assuming the transaction is done on a cash-free, debt-free (CFDF) basis.
If a deal is structured as CFDF, the purchase price is the enterprise value to the buyer.
From the opposite end of the table, CFDF from the seller’s perspective means the seller gets to retain the excess cash on the balance sheet (excluding the cash required to continue operating), but in return, must pay off any outstanding debt liabilities using the proceeds from the sale.
2. LBO Financing Assumptions
Next, we can calculate the transaction fees, where for illustrative purposes – we’ll assume the transaction fees related to advisory fees paid to investment banks, consultants and lawyers is equal to 2.0% of the total enterprise value.
By multiplying $250mm by the 2.0% transaction fees assumption, the transaction fees come out to approximately $5mm.
- Transaction Fees % TEV = 2.0%
- Transaction Fees = 2.0% × $250 million = $5 million
On a similar note, the financing fees can be calculated by adding up the total initial debt raised and multiplying by the 3.5% financing fee assumption.
- Financing Fees % Total Debt = 2.0%
For modeling on the job, the financing fees are calculated individually for each tranche, but for this exercise, we’re using simplified assumptions and just using the total debt. Therefore the sum of the debt ($175.0m) is multiplied by the 3.5% financing fees assumption for us to get $6.1m for the financing fees.
- Financing Fees = 3.5% × $175 million = $6.1 million
To wrap up the uses section, the final line item is the “Cash to B/S”, which directly links to the hardcoded input of $5.0m.
- Cash to B/S = $5 million
3. LBO Sources of Funds Calculation Example
Moving onto the other side, the “sources” will list where the funding for the transaction comes from.
The predominant source of funds will be in the form of debt capital.
Typically, a private equity firm attempts to raise as much senior debt (i.e., from bank lenders) before raising any other types of debt that tend to be costlier.
The relevant assumptions here are the total leverage multiple and senior leverage multiple.
In our example scenario, the total leverage ratio will be 7.0x – meaning, the total debt raised will be assumed to be seven “turns” of EBITDA.
Since the total leverage ratio is 7.0x while the senior leverage is 4.0x, the debt allocatable to subordinated debt is going to be 3.0x.
- Senior Debt = $25 million × 4.0x = $100 million
- Sub Debt = $25.0m × 3.0x = $75 million
4. LBO Rollover Equity and Sponsor Equity Calculation
Now that we have the debt portion filled out, we can now calculate the equity contributions.
The two providers are going to be the existing management team (rollover equity) and the private equity firm (sponsor equity).
The total required equity contribution – i.e. the “shortfall” in capital – can be calculated by deducting the total debt from the total uses.
- Total Equity Requirement = $266.1 million – $175 million = $91.1 million
Then, the management rollover can be calculated by multiplying the rollover assumption (pro forma ownership) by the required equity contribution.
- Management Rollover = 10.0% × $91.1 million = $9.1 million
For the final step, we must calculate the sponsor equity (i.e., the size of the equity check from the PE firm) now that we have the values of the total debt raised and the management rollover.
- Sponsor Equity Contribution = $266.1 million – $184.1 million = $82 million
Note: Alternatively, we could’ve just multiplied the total required equity ($91.1mm) by the implied ownership in the post-LBO company (90.0%).
5. Sources and Uses Model Example
We’ve now completed filling out the sources and uses of funds table and can wrap up by making sure both sides are equal to each other.
Because our total sources cell links directly to the total uses, it’ll be more practical for our formula to sum up all of the line items for each side as opposed to subtracting the bottom cell from each side.
After doing so, we get zero as the output for our check, which confirms that both sides are equal in our model.


Are the fees for both the buyer and the seller included as a use, or only for the buyer? For example, if both sides use a banker.