What is Same Store Sales?
The Same Store Sales metric compares the performance of an individual store in a given period relative to the same period in the prior year.

How to Calculate Same Store Sales
Using the same-store sales metric, companies can compare each store’s individual performance against its performance in the previous year.
By measuring a store’s performance over a specified time frame, the company and investors alike can determine whether a given store is outperforming, underperforming, or on par with the past.
In particular, the same-store sales metric is useful for decision-making by upper-level management of publicly-traded companies, i.e. the market will often scrutinize a company for not shutting down unprofitable locations that are weighing down on the overall company’s profit margins.
Therefore, the metric is not only for stores to track their progress but also to ensure that their performance is sufficient to meet the expectations of others.
If a specific store is evidently lagging behind its peers, it is the corporate management team’s responsibility to identify the source of the problem and provide a solution to the store.
Same Store Sales Formula
In order to calculate the same store sales metric, a store’s sales in the current period are divided by its sales in the prior period.
After that, the result must be multiplied by 100 to express it in percentage form.
The formula for the metric is as follows.
The drivers of same-store sales growth are 1) the price of products being sold, and 2) the total number of transactions.
- Price → The price is largely determined by the market (and competitors), but the average order value (AOV) is affected by product mix, promotional tactics, and advertising among various other factors.
- Total Number of Transactions → The total number of transactions — i.e. store traffic — represents a volume metric that tracks the number of conversions (i.e. from potential customer to checkout).
The relationship between the price and the number of transactions is that more transactions directly reduce the company’s reliance on pricing to generate enough revenue.
On the other hand, setting prices higher to meet revenue expectations can often be counter-productive because fewer customers can afford to purchase the products.
The Wharton Online & Wall Street Prep Applied Value Investing Certificate Program
Learn how institutional investors identify high-potential undervalued stocks. Enrollment is open for the Feb. 10 - Apr. 6 cohort.
Enroll TodaySame Store Sales Calculator
We’ll now move to a modeling exercise, which you can access by filling out the form below.
Chipotle Same Store Sales Calculation Example
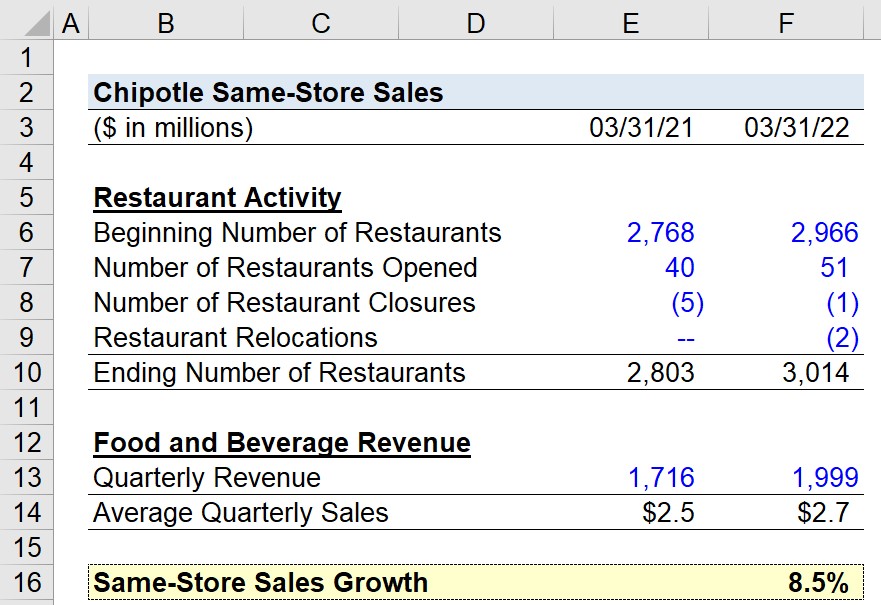
In Q-1 2022, Chipotle’s “Food and Beverage” division generated approximately $2 billion in revenue.
During the same period in the prior year, the division brought in $1.7 billion in revenue.
The exact revenue assumptions we’ll use in our calculation are as follows:
Food and Beverage Quarterly Revenue
- Q-1 2020 Revenue = $1,716 million
- Q-1 2021 Revenue = $1,999 million
As for the restaurant data, we’ll use the average between the beginning and ending number of restaurants.
Chipotle Q-1 2021 Store Data
- Beginning Number of Restaurants = 2,768
- Number of Restaurants Opened = 40
- Number of Restaurant Closures = (5)
- Restaurant Relocations = (2)
- Ending Number of Restaurants = 2,803
Chipotle Q-1 2022 Store Data
- Beginning Number of Restaurants = 2,966
- Number of Restaurants Opened = 51
- Number of Restaurant Closures = (1)
- Restaurant Relocations = (2)
- Ending Number of Restaurants = 3,014
Upon dividing the quarterly revenue by the average number of restaurants, we arrive at average quarterly sales.
From there, the implied same-store sales growth is 8.5%.
- Same-Store Sales Growth = $2.7 million ÷ $2.5 million = 8.5%
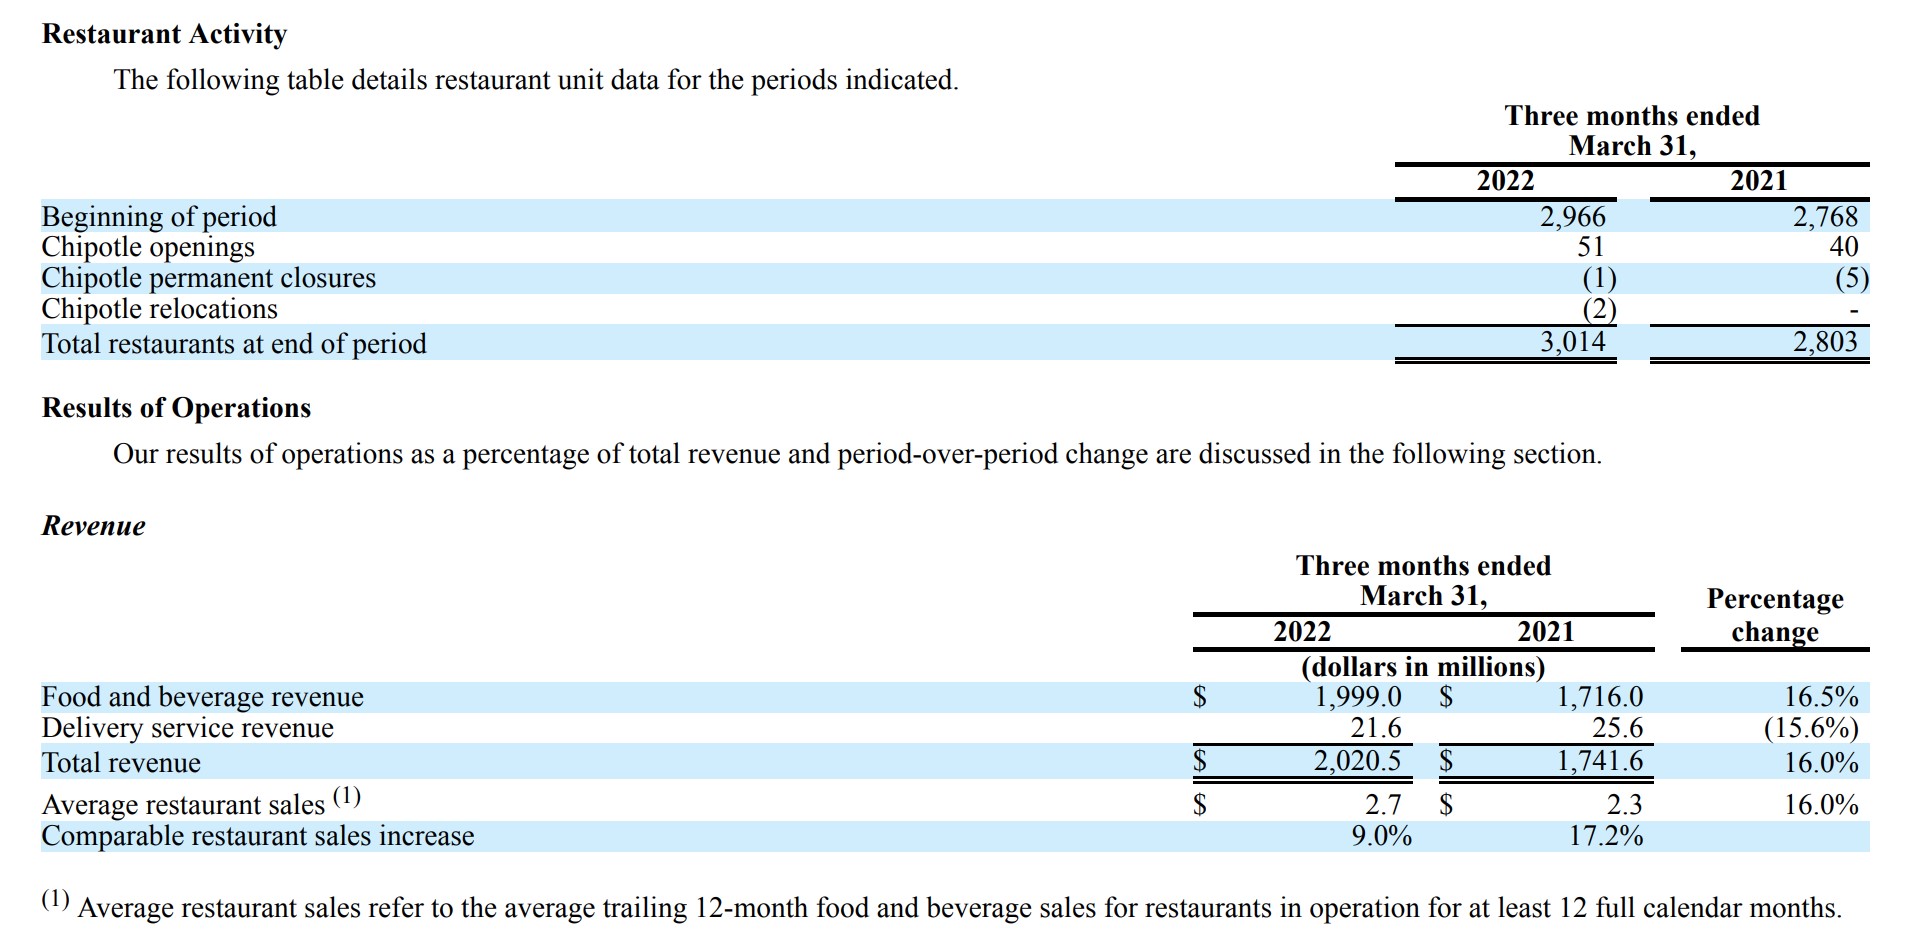
Per Chipotle’s quarterly filing, the stated comparable restaurant sales increase was 9.0%, which is slightly off from our calculation.
The difference is attributable to our simplified average sales figure in our same-store sales calculation, completed for illustrative purposes.
Since Chipotle has far more access to internal data, its calculation is more precise and only takes the average sales of stores in operation for a minimum of 12 months.
“Average restaurant sales refer to the average trailing 12-month food and beverage sales for restaurants in operation for at least 12 full calendar months”
Chipotle 10-Q Footnote (Source: 10-Q Filing)
Chipotle Comparable Restaurant Sales Increase (Source: 10-Q)


