
- What is a Reverse DCF Model?
- How to Build Reverse DCF Model
- Reverse DCF Model Calculator — Excel Template
- 1. Operating Assumptions
- 2. Financial Forecast and Free Cash Flow Calculation
- 3. Terminal Value Calculation (TV)
- 4. Enterprise Value to Equity Value Bridge
- 5. Reverse DCF Model Calculation Example
- 6. Reverse DCF Implied Growth Rate Analysis
What is a Reverse DCF Model?
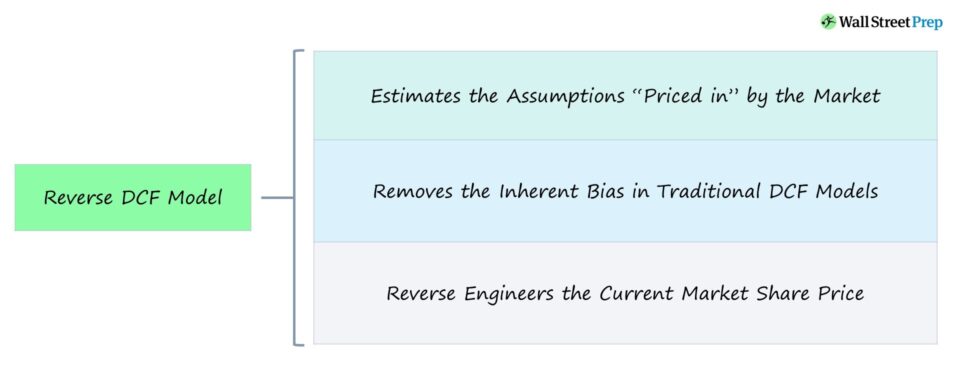
The Reverse DCF Model attempts to reverse-engineer the current share price of a company to determine the assumptions implied by the market.
How to Build Reverse DCF Model
In the traditional discounted cash flow model (DCF), the intrinsic value of a company is derived as the sum of the present value of all future free cash flows (FCFs).
Using discretionary assumptions regarding a company’s future growth, profit margins, and risk profile (i.e. its discount rate), the company’s future FCFs are estimated and can then discounted to the present date.
A reverse DCF “inverts” the process by beginning with the company’s current share price, rather than the other way around.
From the market price – the starting point of the reverse DCF – we can determine what set of assumptions are “priced in” to justify the current share price, i.e. what assumptions are implicitly embedded within the current market valuation of the company.
The reverse DCF is less about attempting to accurately project a company’s future performance and more about understanding the underlying assumptions supporting the company’s current market share price.
More specifically, the reverse DCF is designed to remove the bias inherent in all DCF valuation models, and to provide straightforward insights into what the market is predicting.
The Wharton Online & Wall Street Prep Applied Value Investing Certificate Program
Learn how institutional investors identify high-potential undervalued stocks. Enrollment is open for the Feb. 10 - Apr. 6 cohort.
Enroll TodayReverse DCF Model Calculator — Excel Template
We’ll now move to a modeling exercise, which you can access by filling out the form below.
1. Operating Assumptions
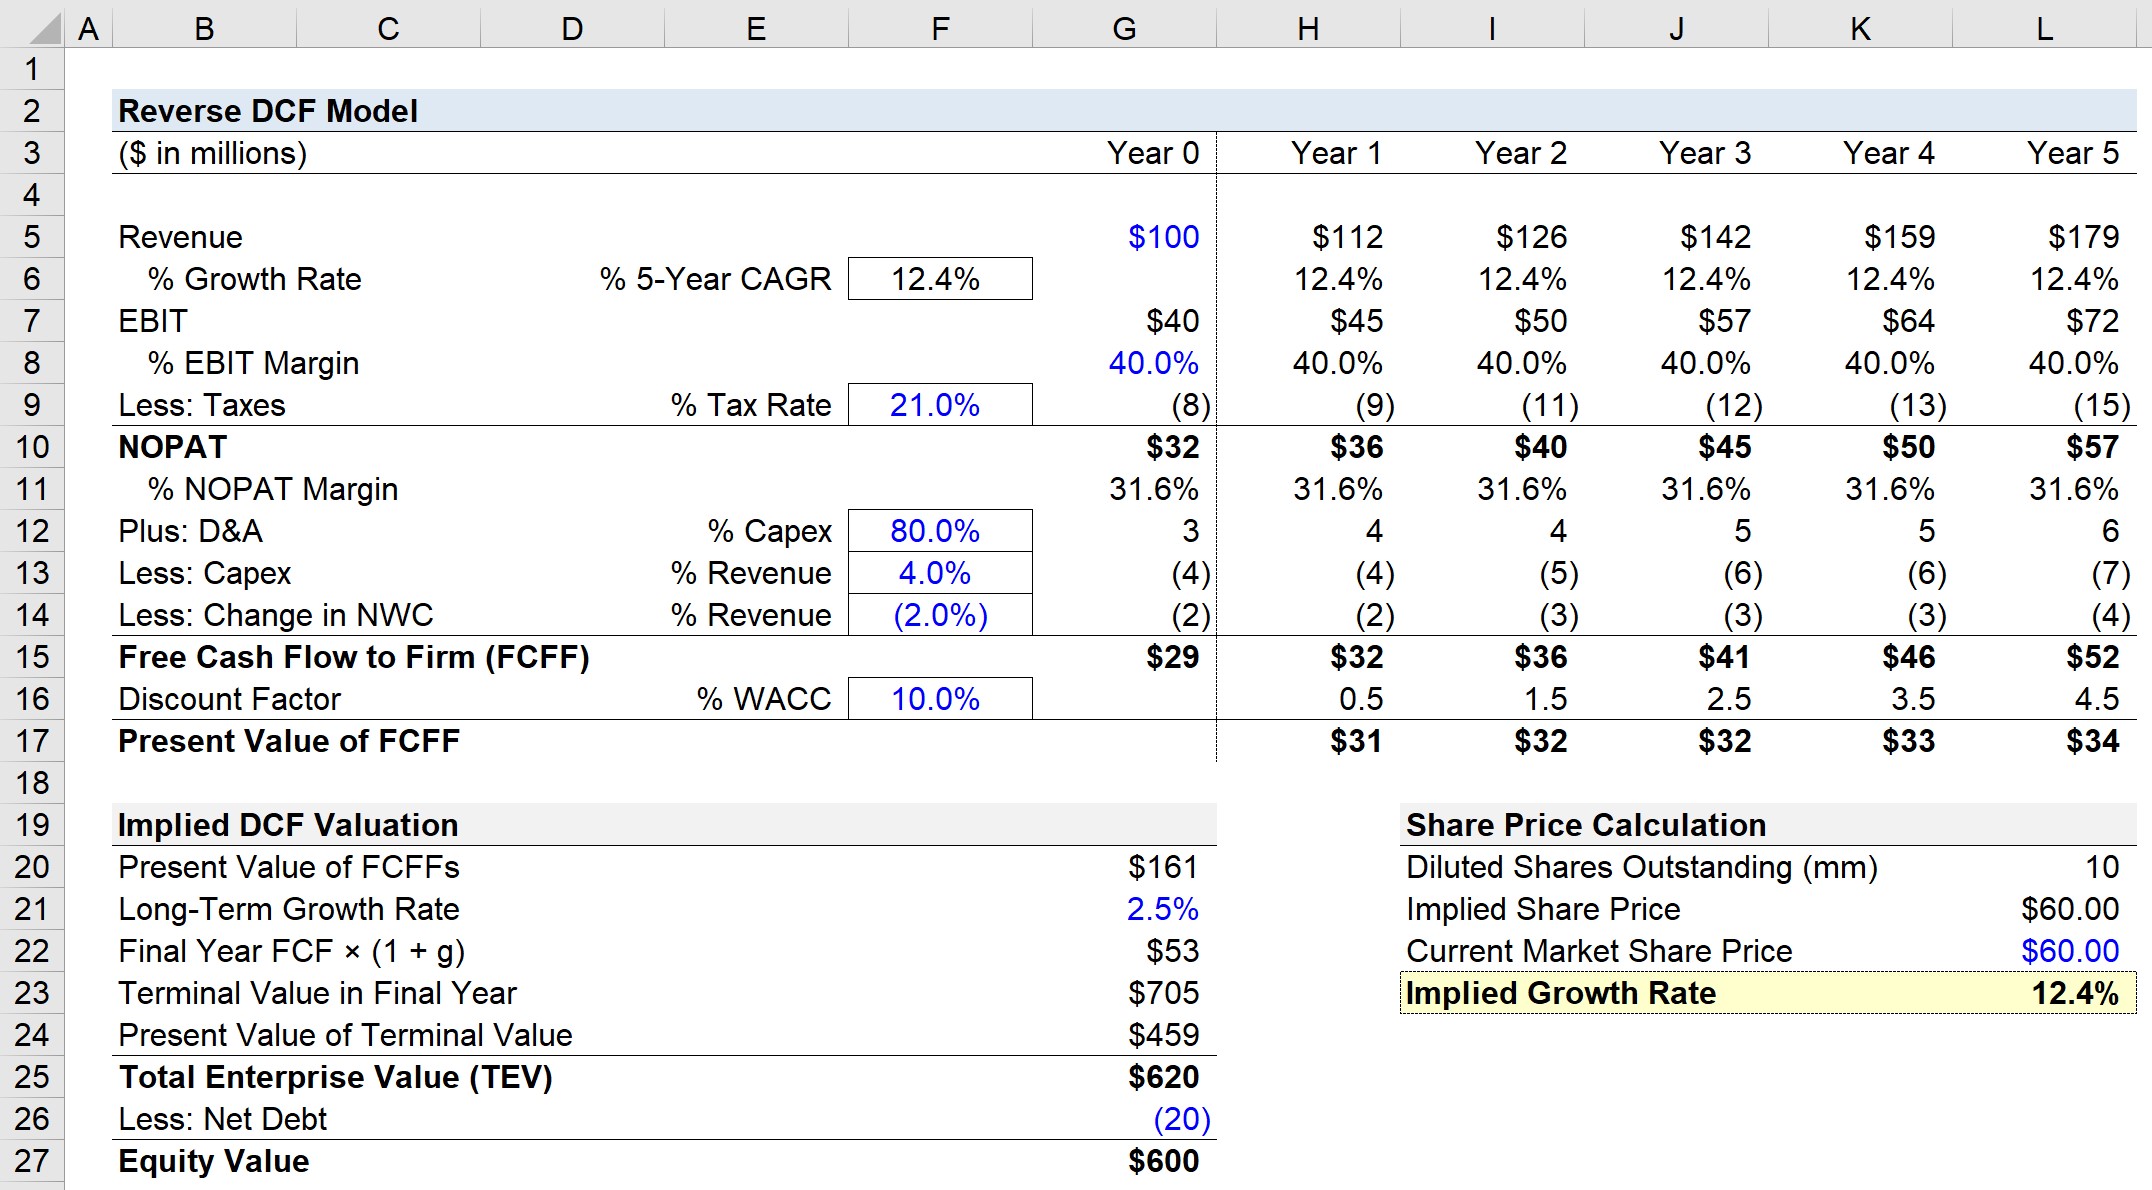
Suppose a company generated $100 million in revenue in the trailing twelve months (TTM) period.
Regarding the assumptions necessary to calculate the company’s free cash flow to firm (FCFF), we will use the following inputs:
- EBIT Margin = 40.0%
- Tax Rate = 21%
- D&A % Capex = 80%
- Capital Expenditures % of Revenue = 4%
- Change in NWC = 2%
For the entire free cash flow (FCF) projection period – i.e. Stage 1 – the assumptions provided above will be kept constant throughout (i.e. “straight-lined”).
From revenue, we’ll multiply our EBIT margin assumption to calculate EBIT for each period, which will be tax-affected to calculate the net operating profit after taxes (NOPAT).
- EBIT = % EBIT Margin × Revenue
- NOPAT = % Tax Rate × EBIT
2. Financial Forecast and Free Cash Flow Calculation
In order to calculate the FCFF for years one to five, we’ll add D&A, subtract capital expenditures, and finally subtract the change in net working capital (NWC).
- FCFF = NOPAT + D&A – Capex – Change in NWC
The next step is to discount each FCFF to the present value by dividing the projected amount by (1 + WACC) raised to the discount factor.
Our company’s WACC will be assumed to be 10%, while the discount factor will be the period number minus 0.5, following the mid-year convention.
- WACC = 10%
After all the FCFFs are discounted to the current date, the sum of the Stage 1 cash flows equals $161 million.
3. Terminal Value Calculation (TV)
For the terminal value calculation, we’ll use the perpetuity growth method and assume a long-term growth rate of 2.5%.
- Long-Term Growth Rate = 2.5%
We’ll then multiply the 2.5% growth rate by the final year’s FCF, which comes out to $53 million.
The terminal value in the final year equals the $53 million divided by our 10% WACC minus the 2.5% growth rate.
- Terminal Value in Final Year = $53 million / (10% – 2.5%) = $705 million
Since the DCF is based on the date of the valuation (i.e. as of the present date), the terminal value must also be discounted to the present date by dividing the terminal value by (1 + WACC) ^ Discount Factor.
- Present Value of Terminal Value = $705 million / (1 + 10%) ^ 4.5
- PV of Terminal Value = $459 million
4. Enterprise Value to Equity Value Bridge
The enterprise value (TEV) equals the sum of the projected FCFF values (Stage 1) and terminal value (Stage 2).
- Enterprise Value (TEV) = $161 million + $459 million = $620 million
To calculate equity value from enterprise value, we must deduct the net debt, i.e. total debt minus cash.
We’ll assume the net debt of the company is $20 million.
- Equity Value = $620 million – $20 million = $600 million
5. Reverse DCF Model Calculation Example
In the final part of our exercise, we’ll calculate the implied growth rate from our reverse DCF.
Let’s assume the company has 10 million diluted shares outstanding, with each share currently trading at $60.00.
- Diluted Shares Outstanding: 10 million
- Current Market Share Price: $60.00
So the question our reverse DCF answers must answer is, “What revenue growth rate is the market pricing into the current share price?”
Using the goal seek function in Excel, we’ll enter the following inputs:
- Set cell: Implied Share Price (K21)
- To value: $60.00 (Hard-Coded Input)
- By changing cell: % 5-Year CAGR (E6)
6. Reverse DCF Implied Growth Rate Analysis
The implied growth rate comes out to 12.4%, which represents the revenue growth rate that the market has priced into the share price of the company over the next five years.
Note that there are numerous variations of the reverse DCF, and our revenue growth rate model is one of the simplest types.
The overall process is generally similar, but the reverse DCF can be further extended to estimate other variables such as the reinvestment rate, return on invested capital (ROIC), NOPAT margin, and WACC.


is negative Reverse DCF implied growth rate better?
Can we conclude that the implied growth rate 12.4% is what market really implies? After all, the growth rate 12.4% is derived from many of our other discretionary assumptions e.g. profit margin, perpetual growth rate, etc., hence it could be biased by those assumptions, which I suppose cannot really determine… Read more »