
- What is Return on Sales?
- How to Calculate Return on Sales (ROS)?
- Return on Sales Formula (ROS)
- Return on Sales vs. Gross Margin: What is the Difference?
- What are the Pros and Cons of Return on Sales Ratio?
- Return on Sales Calculator | Excel Template
- 1. Income Statement Assumptions
- 2. Return on Sales Calculation Example (ROS)
What is Return on Sales?
The Return on Sales (ROS) is a ratio used to determine the efficiency at which a company converts its sales into operating profit.
How to Calculate Return on Sales (ROS)?
The return on sales ratio (ROS), also known as the “operating margin,” measures the amount of operating income generated per dollar of sales.
Therefore, the return on sales answers the question:
- “How much in operating profits is kept for each dollar of sales generated?”
On the income statement, the “Operating Income” line item – i.e. earnings before interest and taxes (EBIT) – represents the residual profits of a company once its cost of goods (COGS) and operating expenses (SG&A) have been subtracted.
The profits left over after all operating expenses have been accounted for can be used to pay off non-operating expenses such as interest expenses and taxes to the government.
With that said, the more sales that “trickle-down” to the operating income line, the more profitable the company is likely to be – all else being equal.
Return on Sales Formula (ROS)
The return on sales ratio (ROS) establishes a relationship between two metrics:
- Operating Income (EBIT) = Revenue – COGS – SG&A
- Net Sales = Gross Sales – Returns – Discounts – Sales Allowances
Both the operating income and sales of a company can be found on the income statement.
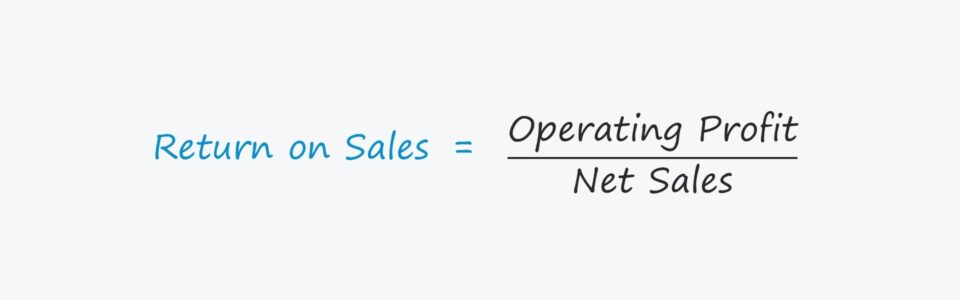
The formula for calculating the return on sales ratio consists of dividing operating profit by sales.
In order to express the ratio as a percentage, the calculated amount must then be multiplied by 100.
By denoting the ratio in percentage form, it is easier to conduct comparisons across historical periods and against industry peers.
Return on Sales vs. Gross Margin: What is the Difference?
The gross margin and the return on sales (i.e. operating margin) are two frequently used metrics to evaluate a company’s profitability.
Both the gross margin and return on sales metric compare a company’s profit metric to its total net sales in the corresponding period. The difference is that the gross margin utilizes the gross profit in the numerator, whereas the return on sales utilizes operating profit (EBIT).
Moreover, the gross profit only subtracts COGS from sales, but operating profit subtracts both COGS and operating expenses (SG&A) from sales.
What are the Pros and Cons of Return on Sales Ratio?
The return on sales uses operating income (EBIT) as the numerator to measure a company’s profitability.
The operating income metric is capital structure independent (i.e. pre-interest expense) and is not affected by differences in tax rates.
Hence, the operating profit (and operating margin) is widely used to compare the performance of different companies along with EBITDA (and the EBITDA margin), such as in financial ratios and valuation multiples.
One drawback to using the return on sales ratio, however, is the inclusion of non-cash expenses, namely depreciation and amortization.
The entire cash flow impact of capital expenditures (Capex) – typically the most significant outflow of cash related to core operations – is also not reflected by the operating profit metric.
Return on Sales Calculator | Excel Template
We’ll now move to a modeling exercise, which you can access by filling out the form below.
1. Income Statement Assumptions
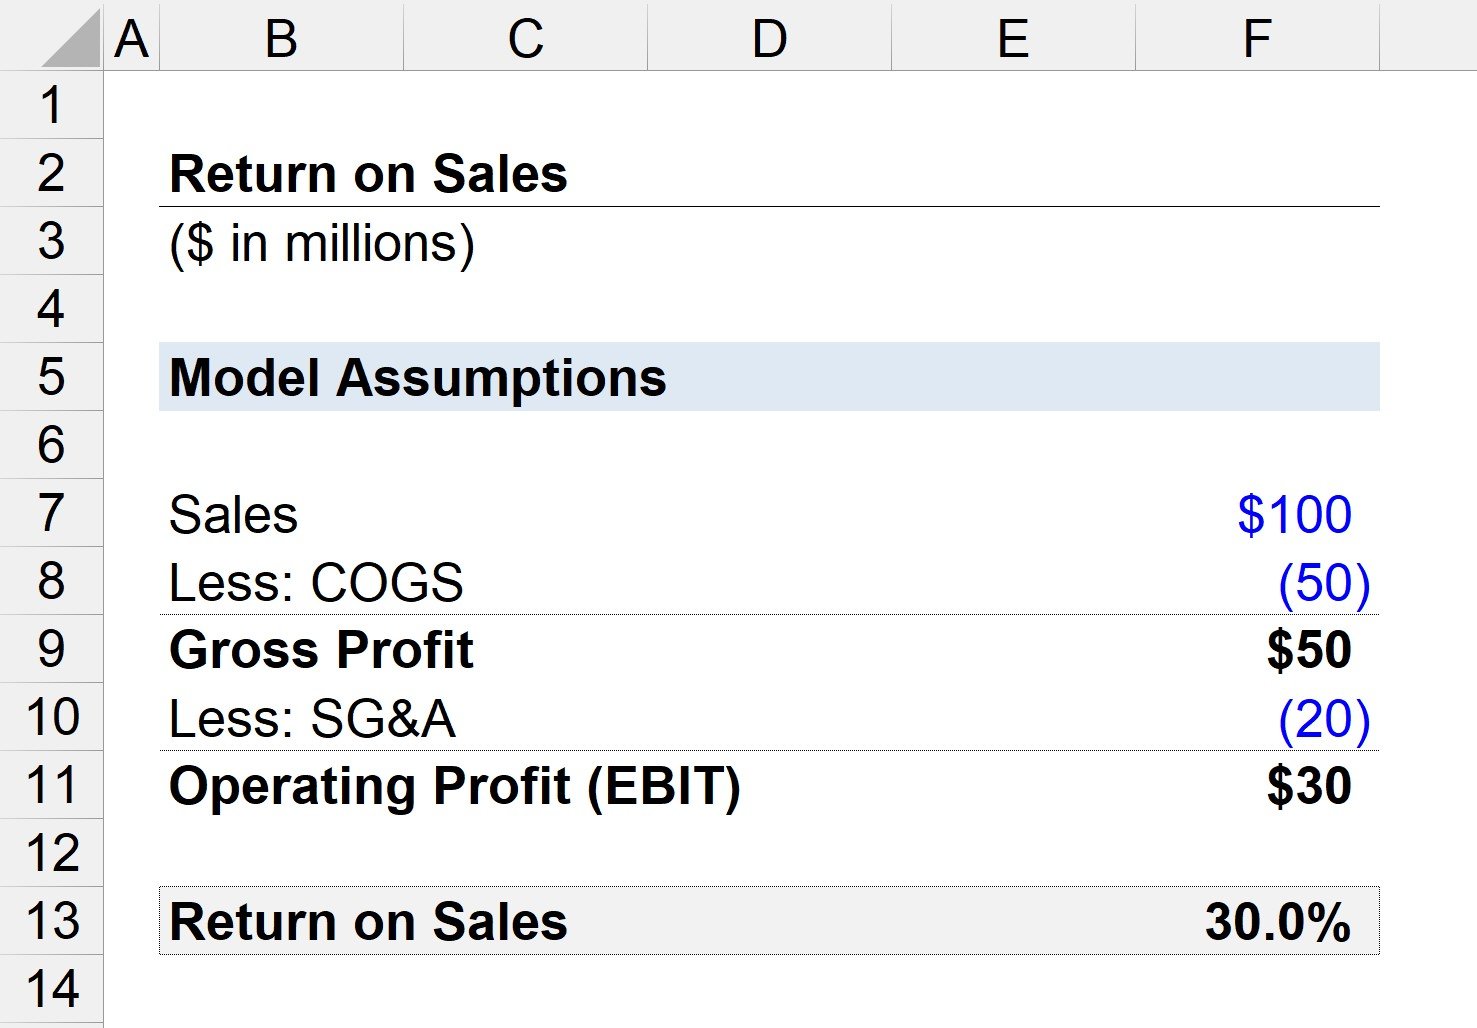
Suppose we have a company that generated a total of $100 million in sales, with $50 million in COGS and $20 million in SG&A incurred.
- Sales = $100 million
- Cost of Goods Sold (COGS) = $50 million
- Selling, General and Administrative (SG&A) = $20 million
If we subtract COGS from sales, we are left with $50 million in gross profit (and a 50% gross margin).
- Gross Profit = $100 million – $50 million = $50 million
- Gross Profit Margin = $50 million / $100 million = 0.50, or 50%
Next, we can subtract SG&A from gross profit to arrive at the company’s operating income (EBIT).
- Operating Income (EBIT) = $50 million – $20 million = $30 million
2. Return on Sales Calculation Example (ROS)
Since we now have the two necessary inputs to calculate the ROS ratio – we can now divide the operating profit by sales to arrive at a return on sales of 30%.
Therefore, the 30% return on sales ratio implies that if our company generates one dollar of sales, $0.30 flows down to the operating profit line.
- Return on Sales (ROS) = $30 million ÷ $100 million = .30, or 30%

Everything You Need To Master Financial Modeling
Enroll in The Premium Package: Learn Financial Statement Modeling, DCF, M&A, LBO and Comps. The same training program used at top investment banks.
Enroll Today


