
- What is Return on Assets?
- How to Calculate Return on Assets (ROA)
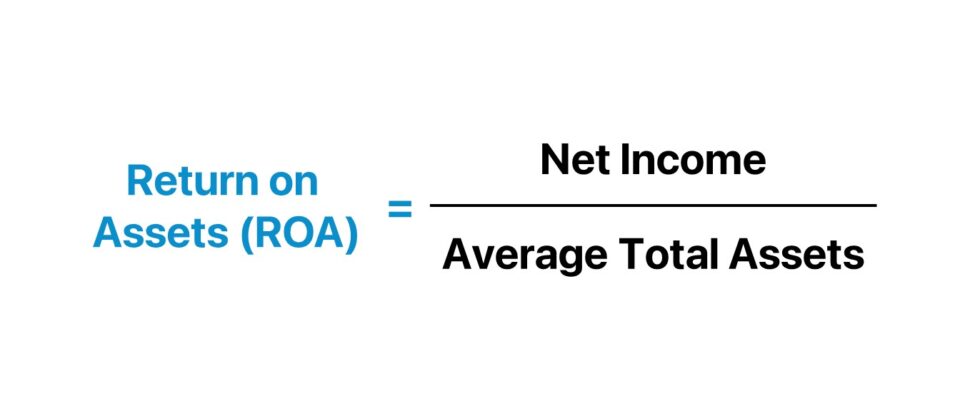
- Return on Assets Formula (ROA)
- What is a Good Return on Assets Ratio?
- ROA vs. ROE: What is the Difference?
- Return on Assets Calculator (ROA) | Excel Template
- 1. Balance Sheet Assumptions
- 2. Income Statement Forecast Build
- 3. Return on Assets Calculation Example
- 4. Return on Assets (ROA) Ratio Analysis
What is Return on Assets?
The Return on Assets (ROA) is a profitability ratio that reflects the efficiency at which a company utilizes its total assets to generate more net earnings, expressed as a percentage.
By comparing a company’s net income (i.e. the “bottom line”) to the average balance of its total assets, the return on assets (ROA) metric offers practical insights regarding the profitability of a given company relative to its total asset base.
- The return on assets (ROA) is a financial ratio that measures the efficiency at which profits are generated by a company relative to the average (or ending) total assets balance.
- The return on assets, or ROA, is a method to determine the efficiency at which a company's management team can utilize the assets on its balance sheet to generate more net profits.
- The formula to calculate the return on assets (ROA) ratio divides a company's net income by the average balance of its total assets, i.e. the beginning and ending total assets balance.
- The higher the ROA ratio, the more efficiently a company’s management team utilizes its total asset base to generate more profits (and vice versa).
How to Calculate Return on Assets (ROA)
The return on assets (ROA) metric tracks the efficiency at which a company can use its assets to produce more net profits.
The more value a company can extract from the assets on its balance sheet, the more efficient the company operates since its assets are utilized near full capacity to maximize profits at the net income level (i.e. the “bottom line”).
Return on assets (ROA) is a measure of operational efficiently, which refers to the capability of a company to generate a profit given its asset base.
If management can allocate resources well, the company’s profitability tends to increase, as fewer expenses and capital expenditures are required to achieve a certain level of output.
Generally, all companies should strive to maximize the output level with the required spending kept at a minimum – as this means the company is operating near full capacity and efficiency.
At the core of the metric, the return on assets (ROA) answers the following question: “How much is the company earning in net income for each dollar of assets owned?”
Return on Assets Formula (ROA)
The return on assets (ROA) metric is calculated using the following formula, wherein a company’s net income is divided by its average total assets.
Where:
- Net Income = Pre-Tax Income (EBT) – Taxes
- Average Total Assets = (Beginning + Ending Total Assets) ÷ 2
Furthermore, the calculated ROA is then expressed in percentage form, which allows for comparisons among peer companies, as well as for assessing changes year-over-year.
The numerator, net income, comes from the income statement, while the denominator, the balance of the average assets, comes from the balance sheet.
Note the mismatch in timing – i.e. the income statement covers a specific period, but the balance sheet is a snapshot at one specific point in time – hence, the average between the beginning and ending balance of the total assets in a given time period is used in the formula.
What is a Good Return on Assets Ratio?
Simply put, companies with a consistently higher return on assets ratio (ROA) can derive more profits using the same amount of assets as comparable companies with a lower return on assets ratio.
Therefore, companies more efficient at utilizing their asset base – evident by a consistently high ROA relative to comparable companies – are more likely to perform well over the long run and become market leaders with higher profit margins.
- Higher Return on Assets (ROA) → For companies with an ROA higher than comparable companies, it can be reasonably assumed that the company’s assets are being used near full capacity or at the very least, used more efficiently than its industry peers.
- Lower Return on Assets (ROA) → On the other hand, a lower ROA relative to the industry average can be a red flag indicating that management might not be deriving the full potential benefits from the assets it owns.
For the return on assets (ROA) metric to be useful in comparisons, the companies must be in the same (or similar) sector, as industry averages vary significantly.
But besides comparisons to industry competitors, another use case of tracking ROA is for tracking changes in performance year-over-year.
- Increasing Return on Assets (ROA) → If a company’s ROA is rising over time, that suggests the company is improving on its ability to increase its profits with each dollar of asset owned.
- Decreasing Return on Assets (ROA) → If a company’s ROA is declining, this indicates the company might have purchased too many assets and/or is failing to utilize its assets to their full capacity.
The Wharton Online & Wall Street Prep Applied Value Investing Certificate Program
Learn how institutional investors identify high-potential undervalued stocks. Enrollment is open for the Feb. 10 - Apr. 6 cohort.
Enroll TodayROA vs. ROE: What is the Difference?
The relationship between return on assets (ROA) and return on equity (ROE) is directly related to the topic of debt financing, i.e. the reliance on leverage in the capital structure.
The difference between return on assets (ROA) and return on equity (ROE) is that the ROA metric does not factor in debt in a company’s capital structure.
For a company carrying no debt on its balance sheet – i.e. an all-equity firm – its shareholders’ equity and its total assets will be equivalent (and ROA and ROE would be equal).
But if those companies were to raise debt capital, their ROE would rise above their ROA from the increased cash balance, as total assets would rise while equity decreases.
Return on Assets Calculator (ROA) | Excel Template
We’ll now move to a modeling exercise, which you can access by filling out the form below.
1. Balance Sheet Assumptions
For our modeling exercise, we’ll be assuming the following operating assumptions.
Balance Sheet Assumptions (Year 1)
- Cash & Cash Equivalents: $20m
- Accounts Receivables (A/R): $40m
- Inventories: $60m
- PP&E, net: $120m
Here, we’ll assess two different scenarios, which we can toggle between in the “Case” cell (L3).
- Upside Case
- Downside Case
With Year 1 as our starting point, we’ll assume the following year-over-year changes on the B/S.
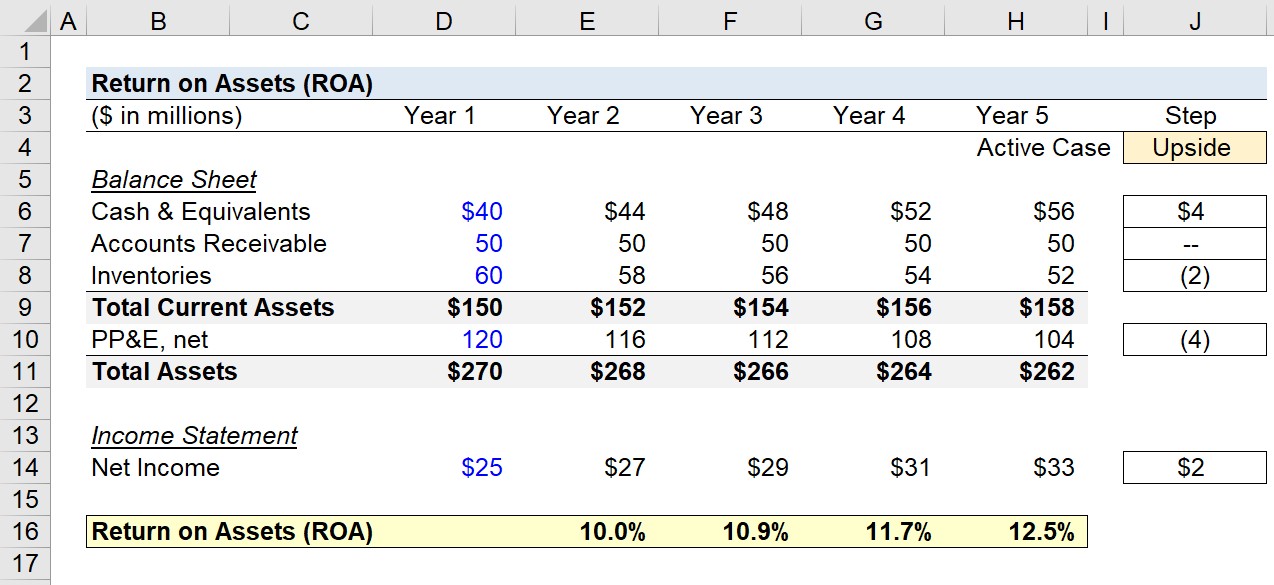
Upside Case Assumptions
- Cash & Cash Equivalents: +$4m
- Accounts Receivables (A/R): $0m – No Change
- Inventories: –$2m
- PP&E, net: –$4m
If the active case is set to “Upside”, the “Total Current Assets” increases from $150m in Year 1 to $158m by the end of Year 5.
Under the same time horizon, the “Total Assets” balance decreases from $270m to $262m.
The takeaway is that the current asset balance is trending upward, but the cause of the positive +$8m change is caused by the cash balance increase, not inventories.
Regarding the fixed assets base (i.e. the PP&E), the decline of $16m implies fewer capital expenditures are required.
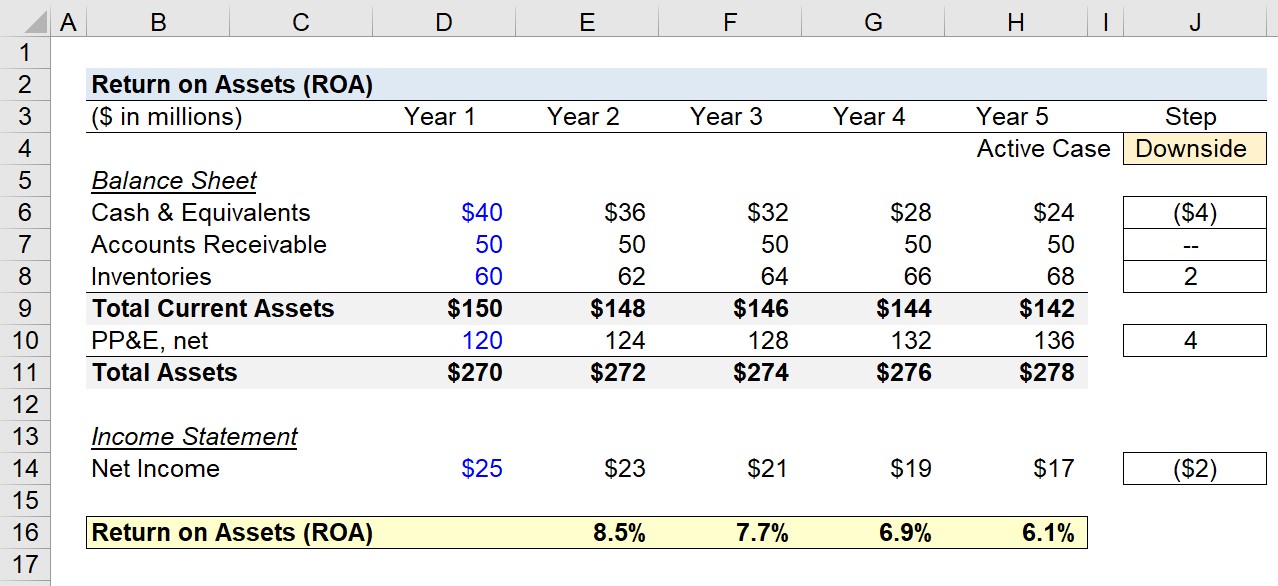
As for the other case, if we set the active case to “Downside” instead, the signs in the “Step” column are each flipped.
Downside Case Assumptions
- Cash & Cash Equivalents: –$4m
- Accounts Receivables (A/R): $0m – No Change
- Inventories: +$2m
- PP&E, net: +$4m
The net impact is the “Total Current Assets” declines from $150m in Year 1 to $142m in Year 5 – a total decrease of $8m.
For the “Total Assets” line item, the balance increases from $270m in Year 1 to $278m in Year 5.
The increase in PP&E sitting on the B/S can be interpreted as increased CapEx spending, which is often caused by lackluster growth and/or increased competition in the market.
2. Income Statement Forecast Build
In the next step, all that remains to complete our return on assets (ROA) calculations is the net income assumptions.
Income Statement Assumptions
- Net Income in Year 1 = $25m
- Upside Case YoY Change = +$2m
- Downside Case YoY Change = –$2m
Under the “Upside Case”, net income increases from $25m to $33m, whereas in the “Downside Case”, net income declines from $25m to $17m.
3. Return on Assets Calculation Example
In the next part of our exercise, we’ll divide the net income in each period by the average balance between the prior period and current period “Total Assets” balance, we can calculate the ROA for the projection period.
To reiterate from earlier, the equation for calculating the return on assets is shown below.
Return on Assets (ROA) = Net Income ÷ (Average Total Assets)
For the “Upside Case”, the company’s return on assets (ROA) increases from 10.0% to 12.5% – which implies more efficient resource allocation, causing increased net earnings.
For instance, the cash balance is increasing, which means the company has more liquidity on hand and fewer cash outflows related to inventory purchases and Capex.
The decline in inventory signifies faster inventory turnover from increased customer demand, and the declining PP&E means more value is being created by the existing fixed assets with minimal Capex spending requirements.
4. Return on Assets (ROA) Ratio Analysis
To reiterate from earlier, the higher a company’s ROA, the more operationally efficient management is at generating more profits with fewer investments (and vice versa).
However, in the “Downside Case”, the company’s return on assets (ROA) declines from 8.5% in Year 1 down to 6.1% – with the opposite changes (and implications) on the balance sheet and income statement.
In closing, the return on assets (ROA) metric is a practical method for investors to grasp a better understanding of how efficient a company is at converting its asset purchases into net income.
")

")
")
