
- What is Profitability Ratio?
- How to Calculate Profitability Ratio
- Profitability Ratio Formula
- Gross Margin Ratio Formula
- EBIT Margin Ratio Formula
- EBITDA Margin Ratio Formula
- Net Profit Margin Ratio Formula
- How to Analyze Profitability Ratio
- Profitability Ratio Calculator
- 1. Income Statement Assumptions
- 2. Profit Metrics Calculation Example
- 3. Profitability Ratio Calculation Example
What is Profitability Ratio?
A Profitability Ratio compares a profit measure to revenue to determine the remaining profits after certain types of expenses are deducted.
Profitability ratios are standardized against revenue—i.e. expressed as a percentage of revenue, allowing for comparisons between companies.
How to Calculate Profitability Ratio
A profitability ratio is a financial metric that divides a profit metric by the net revenue generated in the corresponding time period, which provides insights in terms of understanding a company’s historical margin profile (and future trajectory).
For instance, most of a company’s spending could pertain to its cost of goods sold (COGS), operating expenses (OpEx), or non-operating items.
- Cost of Goods Sold (COGS) → The operating costs incurred by companies that are directly related to their efforts to generate revenue.
- Operating Expenses (Opex) → The operating costs necessary for the operations of a business to continue but are not directly related to the revenue production of the company, i.e. indirect costs.
- Non-Operating Expenses → The non-operating expenses incurred by a company that is not expected to be recurring or continue to impact the core operating performance of a company.
A profitability ratio compares a company’s profit metric to its revenue to analyze the efficiency at which the company can convert revenue into earnings over a stated period.
Since profitability ratios are expressed as a percentage of revenue, the metrics are standardized measures that facilitate comparisons between industry peers.
In practice, multiple profitability ratios should be used in conjunction with each other to measure a company’s true financial state and to develop a comprehensive understanding of its cost structure and business model.
The reliance on only one profit metric can lead to misguided interpretations, especially in the absence of a firm grasp of relevant industry-specific considerations.
Profitability Ratio Formula
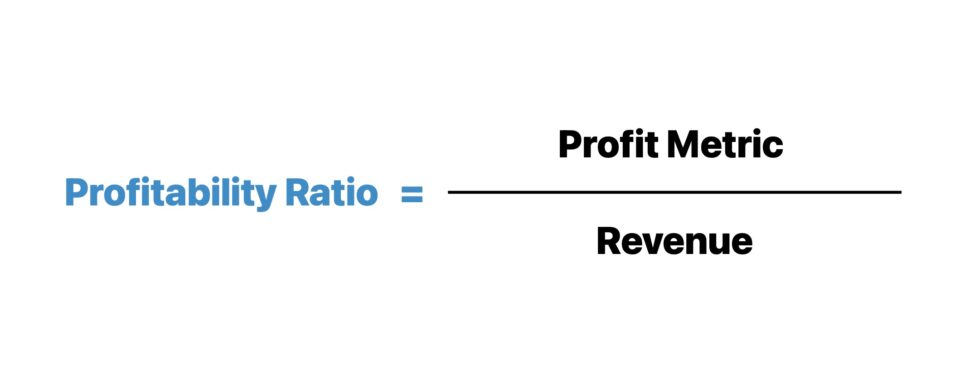
Formulaically, the structure of a profitability ratio consists of a profit metric divided by revenue.
The resulting figure must then be multiplied by 100 to convert the ratio into percentage form.
Once standardized, the ratio can subsequently be used for purposes of comparability, either to the company’s own historical performance or against its closest industry peers.
Gross Margin Ratio Formula
The gross margin ratio compares a company’s gross profit to its revenue.
Since the gross profit metric deducts only one expense—the company’s cost of goods sold (COGS)—the gross margin ratio reflects the percentage of revenue left over after the direct operating costs have been taken into account.
The cost of goods sold (COGS) line item is found right below revenue (or sales) on the income statement and represents the direct costs incurred by a company to generate revenue, e.g. direct materials and direct labor costs.
EBIT Margin Ratio Formula
The EBIT margin ratio, or “operating profit margin,” compares a company’s operating income to its revenue.
Operating income (EBIT) is a GAAP measure of profitability calculated by subtracting operating expenses like SG&A and R&D from gross profit.
Like COGS, operating expenses are also part of the core operations of a company, i.e. the costs that must be incurred for the company to continue operating.
However, the distinction is that operating expenses are not directly related to a company’s process of revenue generation.
Therefore, the EBIT margin ratio represents the percentage of profits remaining once both direct and indirect operating costs—COGS and OpEx—have been deducted from revenue.
EBITDA Margin Ratio Formula
The EBITDA margin ratio compares a company’s EBITDA to its revenue in the corresponding period.
Unlike EBIT, EBITDA is a non-GAAP measure of profitability, so the metric is not typically found on the income statement.
Still, EBITDA is by far the most widely used measure of profitability and is calculated by adding depreciation and amortization (D&A) to EBIT.
Depreciation and amortization expenses are non-cash items, meaning there is no real movement of cash associated with these line items.
Instead, these non-cash expenses are recognized on the income statement to abide by accrual accounting reporting standards.
- Depreciation → The allocation of the purchase cost of fixed assets (PP&E) over the expected useful life of the long-term asset, i.e. the capital expenditure (Capex) is periodically recognized rather than all at once.
- Amortization → Similar to depreciation, amortization allocates the cost of intangible asset purchases over their useful life assumptions, although not all intangible assets can be amortized.
The EBITDA margin ratio thereby reflects the percentage of revenue remaining once all direct and indirect operating costs have been subtracted, with the additional step of removing the effects of non-cash items, namely D&A.
Because EBITDA is a non-GAAP metric, companies have the option to make additional discretionary adjustments, such as for stock-based compensation (SBC).
Therefore, it is essential to question and analyze each adjustment, as opposed to taking the EBITDA figures as stated by management (or by an equity analyst) at face value.
Net Profit Margin Ratio Formula
The net profit margin ratio compares a company’s net income to its revenue.
The net income metric (i.e. the “bottom line”) is the revenue left over once all costs, operating and non-operating, are deducted.
In effect, the net profit margin ratio represents the accrual-based profitability of a company after subtracting all costs, including non-operating costs and taxes.
How to Analyze Profitability Ratio
To properly use profitability ratios in financial analysis and derive accurate insights, it is critical to understand the distinction between operating items and non-operating items.
- Levered Metrics → While there are no issues with using a ratio such as the net profit margin—which is a levered metric (i.e. post-interest) and inclusive of the expenses or income from non-operating items—problems can emerge if the distinction is ignored.
- Unlevered Metrics → Certain profit metrics such as gross profit, operating income (EBIT), and EBITDA are unlevered metrics (i.e. pre-interest), meaning that the effects of non-operating items are excluded.
By excluding non-operating items, the profit metric reflects the core operating performance of the company without the impact of discretionary items such as interest expense and interest income or one-time non-recurring items such as the gain (or loss) on the sale of an asset and inventory write-downs.
The interest expense incurred on debt obligations, such as loans or corporate bonds, are non-operating costs since the capital structure is a discretionary financing decision. In other words, the decision on how a company’s operations are funded (equity vs. debt) is up to management discretion.
Hence, the EBIT and EBITDA margin are two of the most common profitability ratios, particularly for comparative purposes among peer companies.
- Capital Structure Neutral → Only the core operating profit metrics of companies, which are independent of financing decisions like the percent mix of the capital structure, should be used in peer-to-peer comparisons.
- Neglects Income Taxes → Income taxes are jurisdiction-dependent expenses and are affected by factors such as net operating losses (NOLs) and deferred taxes, which are non-core items.
- Non-Recurring Items → There is substantial risk presented by post-levered ratios, which can be skewed by non-core, discretionary items. Further, non-recurring items – most notably, depreciation and amortization (D&A) – are ignored in EBIT and EBITDA because the two expenses are non-cash items, where the real cash outflow occurred on the date of the capital expenditure (Capex).
Profitability Ratio Calculator
We’ll now move on to a modeling exercise, which you can access by filling out the form below.
1. Income Statement Assumptions
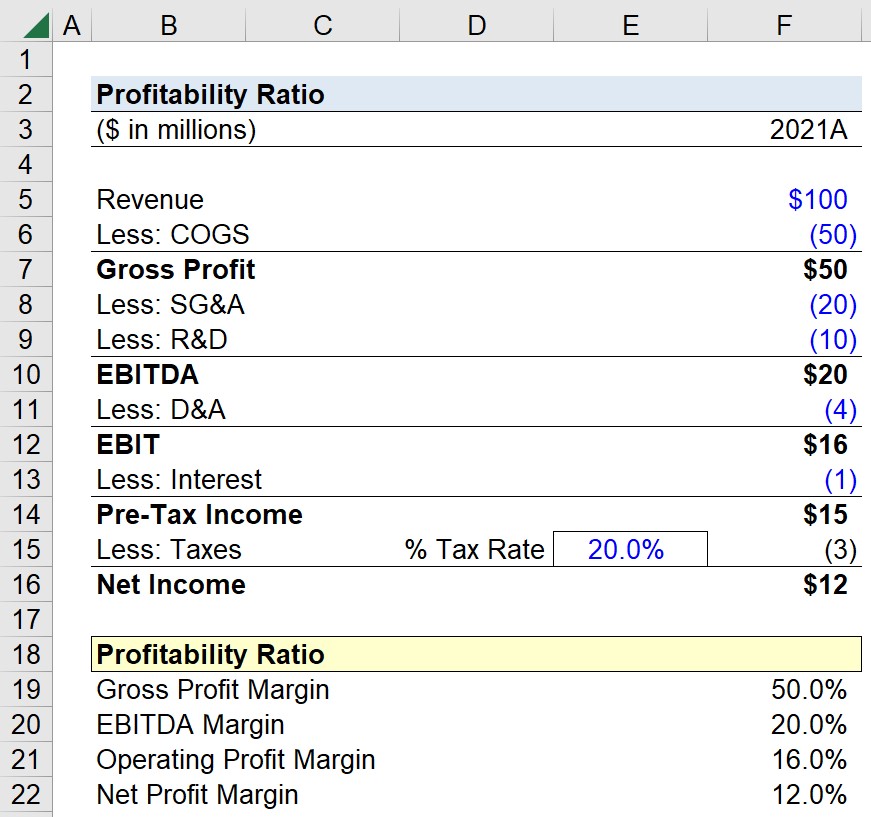
Suppose we’re tasked with calculating the profitability ratios of a company using the following income statement.
| Income Statement | 2021A |
|---|---|
| Revenue | $100 million |
| Less: COGS | (50 million) |
| Gross Profit | $50 million |
| Less: SG&A | (20 million) |
| Less: R&D | (10 million) |
| EBITDA | $20 million |
| Less: D&A | (4 million) |
| Operating Income (EBIT) | $16 million |
| Less: Interest | (1 million) |
| Pre-Tax Income (EBT) | $15 million |
| Less: Taxes @ 20% Tax Rate | (3 million) |
| Net Income | $12 million |
As mentioned earlier, EBITDA cannot be directly reported on the income statement since it is a non-GAAP metric.
Instead, EBITDA must be manually calculated by finding the D&A expense on a company’s cash flow statement (CFS) and adding it back to operating income (EBIT).
2. Profit Metrics Calculation Example
Using the figures from our hypothetical income statement, our next step is to calculate the profit metrics that will be part of our ratio calculations.
While the metrics are already provided on the income statement, we’ll still calculate the profit metrics in Excel rather than hard-coding the values.
FY-2021 Profit Metrics
- Gross Profit = $100 million – $50 million = $50 million
- EBITDA = $50 million – $20 million – $10 million = $20 million
- Operating Income (EBIT) = $20 million – $4 million = $16 million
- Pre Tax Income (EBT) = $16 million – $1 million = $15 million
- Net Income = $15 million – ($15 million x 20%) = $12 million
3. Profitability Ratio Calculation Example
In the final step, we’ll divide each profit metric by revenue to arrive at the following profit ratios for our company in 2021.
The completed calculations of the profitability ratios for fiscal year ending 2021 are as follows.
FY-2021 Profitability Ratios
- Gross Profit Margin Ratio (%) = $50 million ÷ $100 million = 50.0%
- EBITDA Margin Ratio (%) = $20 million ÷ $100 million = 20.0%
- EBIT Margin Ratio (%) = $15 million ÷ $100 million = 16.0%
- Net Profit Margin Ratio (%) = $12 million ÷ $100 million = 12.0%

Everything You Need To Master Financial Modeling
Enroll in The Premium Package: Learn Financial Statement Modeling, DCF, M&A, LBO and Comps. The same training program used at top investment banks.
Enroll Today


