
- What is Preferred Stock?
- How Does Preferred Stock Work?
- Preferred Stock vs. Common Stock: What is the Difference?
- What are the Different Types of Preferred Stock?
- Preferred Stock Calculator
- 1. Preferred Stock Investment Assumptions
- 2. Convertible Preferred Stock Returns Calculation Example
- 3. Participating Preferred Stock Returns Calculation Example
- 4. Preferred Stock Investment Returns Analysis
- 5. Convertible vs. Participating Preferred Stock Returns Graph
What is Preferred Stock?
Preferred Stock is a hybrid form of financing representing ownership in a company, combining features of debt and common stock.
How Does Preferred Stock Work?
Preferred stock is a hybrid security that blends characteristics of both common stock and fixed-income instruments.
- Debt-Like Features→ Similar to traditional bonds, preferred stock generally has a fixed par value with periodic coupon payments. However, preferred stock is still of lower ranking than all bondholders in the capital structure of a company, only senior to the corporation’s common equity.
- Common Stock-Like Features → Like common stock, preferred stock is a class of ownership in the issuing company. These securities sit above common equity in the capital structure, in terms of the priority at which security holders are entitled to a portion of the company’s profits.
In the capital structure of a corporation, preferred stock sits above common equity. However, preferred securities are still of lower seniority relative to all forms of debt, including senior and subordinated debt.
In fact, preferred stock is of lower priority than even the riskier tranches of debt, such as mezzanine financing.
The risk-return profile of preferred stock investments tends to appeal most to institutional investors, such as private equity firms, attempting to maximize the potential upside while limiting the downside.
Preferred Stock vs. Common Stock: What is the Difference?
The “preferred” designation refers to the security’s seniority before common shareholders.
In the event of a liquidation or sale of a company, preferred stock has preferential rights to be paid before all common stock holders (i.e. liquidation preference), including the right to be issued dividends prior to distributions to common shareholders.
The dividend issuances to preferred stockholders usually hold precedence over dividends issued to common equity holders.
The drawback to preferred stock is that most do not provide the holder with the right to vote on corporate matters, contrary to common stock holders.
Unlike common stock, the upside potential on a preferred stock investment is capped. The exception is if the preferred security comes with a conversion feature that allows the holder to convert the preferential shares into common shares.
What are the Different Types of Preferred Stock?
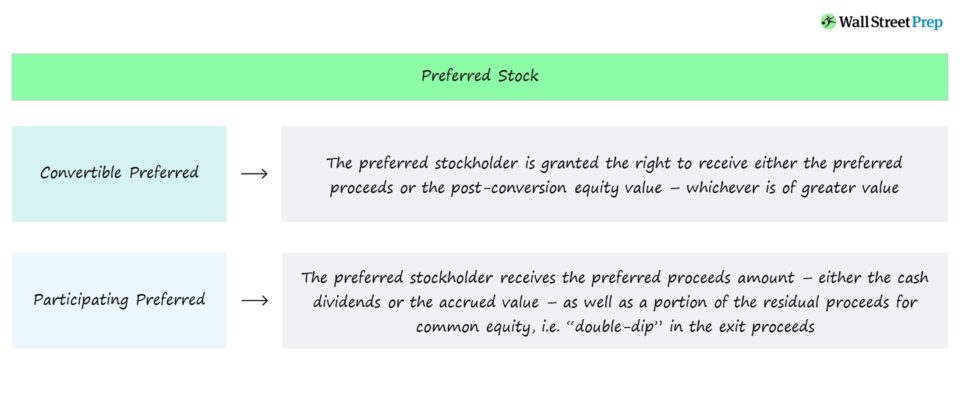
Two of the more frequent types of preferred equity investment structures are convertible preferred and participating preferred stock.
- Convertible Preferred Stock → In the case of convertible preferred stock, the holder is granted the right to receive either the preferred proceeds or the post-conversion equity value. For the latter option, whichever is of greater value and brings higher returns to the investment firm is chosen.
- Participating Preferred Stock → On the other hand, for participating preferred stock, the firm receives the preferred proceeds amount (i.e., cash dividends or accrued value), as well as a portion of the residual proceeds for common equity shareholders – so, the investor gets to “double-dip” in the exit proceeds.
Preferred Stock Calculator
We’ll now move to a modeling exercise, which you can access by filling out the form below.
1. Preferred Stock Investment Assumptions
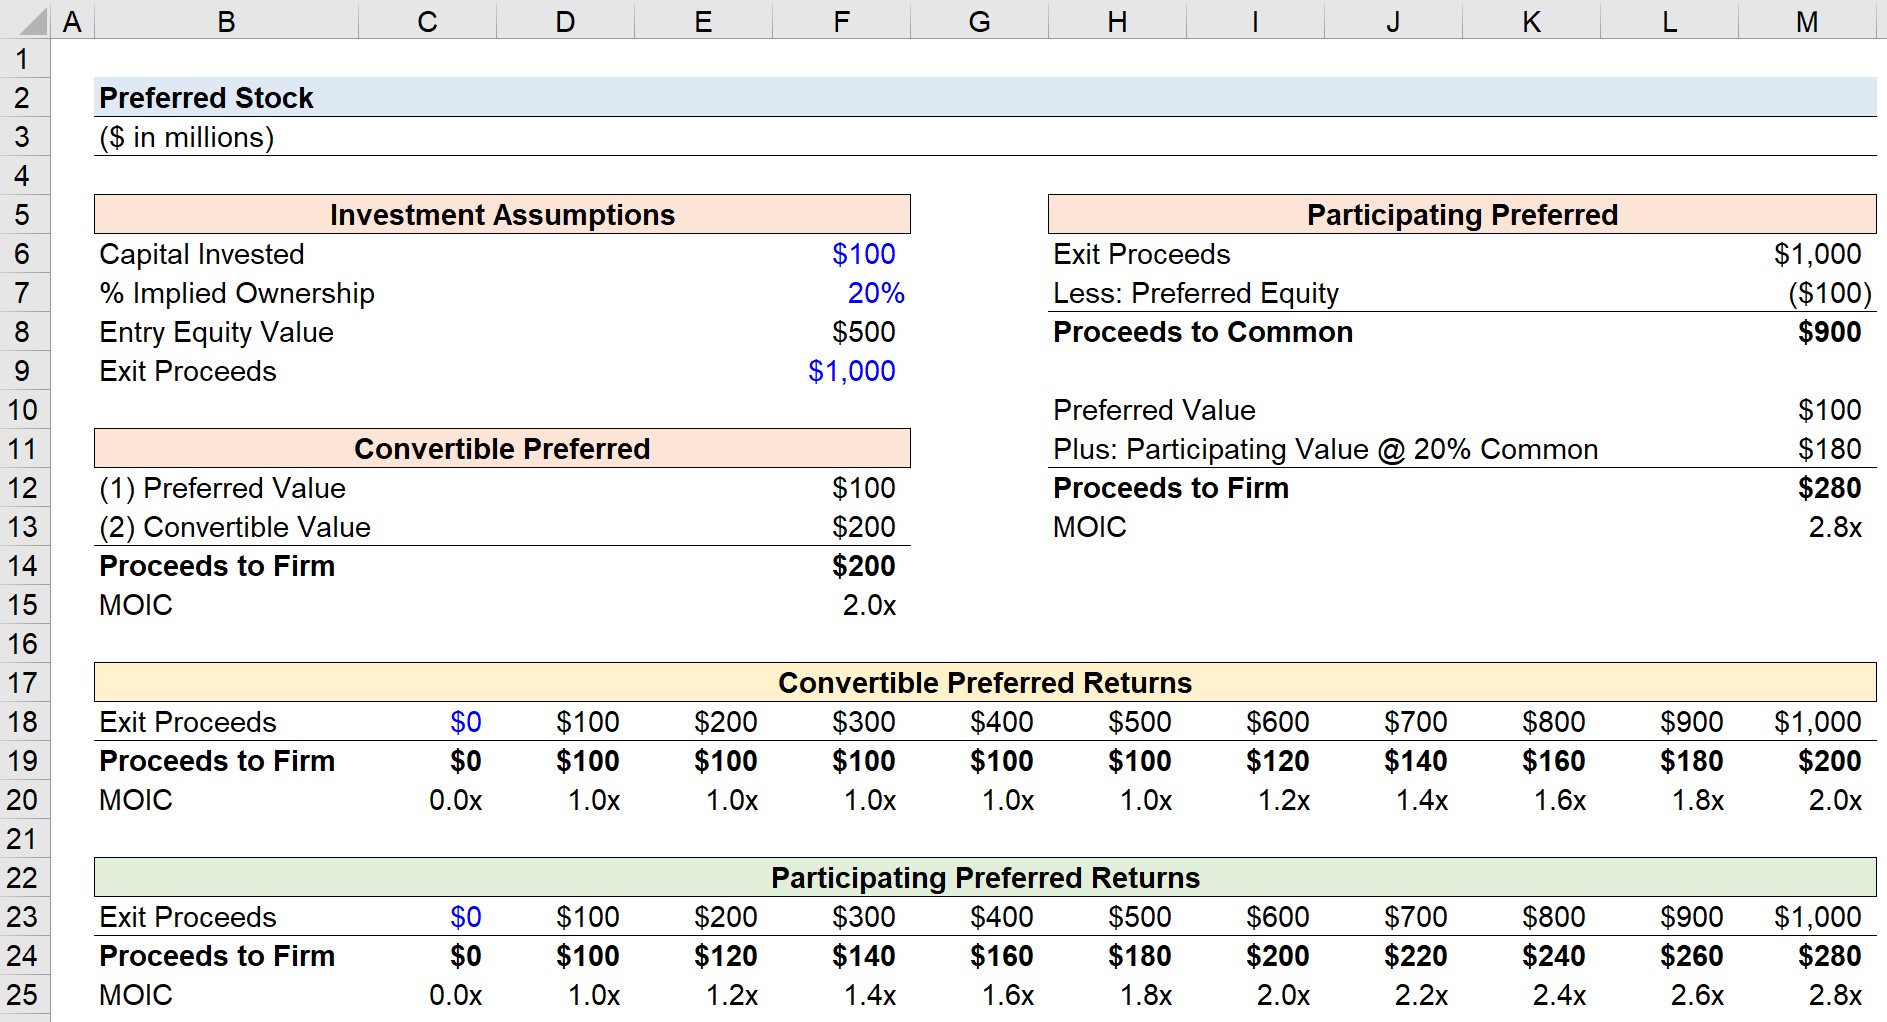
Suppose a private investment firm has decided to invest $100 million for a 20% ownership stake in the target company.
- Capital Invested = $100 million
- % Implied Ownership = 20%
The company holds zero debt on its balance sheet (i.e. 100% preferred and common equity) from the date of initial purchase to the date of exit.
Upon dividing the $100mm of capital invested by the 20% ownership, the implied total equity value of the target is $500mm. As a placeholder, the exit proceeds (i.e., the exit equity valuation) are $1 billion.
- Entry Equity Value = $500 million
- Exit Proceeds = $1 billion
2. Convertible Preferred Stock Returns Calculation Example
In the next part of our exercise, we’ll begin setting up the calculation for the convertible preferred stock returns, given the stated scenario.
- Preferred Value → The preferred value formula contains a “MIN” function that links to the original $100mm capital investment and the value of the exit proceeds. The reason for this is that if the exit equity value is less than the preferred investment, the investors cannot receive the initial amount back in full (i.e., incurred a net loss).
- Convertible Value → The convertible value equals the implied ownership multiplied by the exit proceeds.
Since the convertible preferred stock chooses the higher value, we use the “MAX” function between the preferred value and convertible value.
Therefore, the convertible value of $200mm is selected, as it is the greater of the two compared to the $100 million received from the preferred value.
Under the $1 billion exit scenario, the convertible value is $200mm.
Conversion Ratio and Convertible Price
In practice, convertible preferred stock comes with a pre-negotiated conversion ratio, which determines the number of common shares received per preferred share upon conversion.
After multiplying the number of preferred shares by the conversion ratio, we can calculate the number of convertible common shares.
Then, the conversion price can be calculated by dividing the par value of the convertible preferred stock by the number of common shares that could be received.
Moving on, the assumption here is that the $100 million preferred investment can be converted into 20% of the total common equity.
Since we have the entry valuation, we can deduce that the inflection point where the convertible value exceeds the preferred value will be an exit valuation in excess of $500mm (i.e., 5x initial).
Once past the break-even point, convertible shares are considered “in-the-money” and profitable to convert.
As an example, say the exit value falls to $50mm from the initial valuation of $500mm. That would mean the valuation has fallen 90%. By multiplying the $50mm in exit proceeds by 20%, we get $10mm as the convertible value.
The convertible value is $10mm, while the preferred value is $50mm. Therefore, the preferred value is chosen. This $50mm in proceeds reflects the downside protection of preferred stock.
And after calculating the proceeds, we can back out the multiple on invested capital (“MOIC”) by dividing the proceeds received by the initial investment. For instance, if the exit proceeds are $1bn, the convertible value is $200mm, which represents a 2.0x MOIC.
- MOIC = $200mm ÷ $100mm = 2.0x
3. Participating Preferred Stock Returns Calculation Example
The “participating” portion of participating preferred stock refers to being able to share in the residual shares left for common shareholders after receiving the preferred value.
In contrast, for “non-participating” preferred equity, the investment firm receives the preferred value without being entitled to any of the common proceeds – the exception being if there is a convertible feature attached.
Usually, preferred equity pays out dividends in either cash or paid-in-kind (“PIK”), but we neglect them here for simplicity.
- Preferred Value → To calculate the preferred value, we’ll deduct the value of the preferred equity from the exit proceeds, as well as wrap a “MAX” function around the formula to ensure the value does not dip below zero. The preferred value is the first source of proceeds for the investor.
- Participating Value → Since the investment here is structured as participating preferred, the investor has a 20% share of the residual common equity value.
For example, the $900mm in common equity proceeds is multiplied by 20% to get $180mm.
The sum of the two sources results in $280mm as the total proceeds received under the participating preferred stock investment (and an implied 2.8x MOIC).
- Proceeds to Firm, Participating Preferred = $100 million + $180 million = $280 million
Preferred Stock vs. Common Stock Returns
The preferred equity holders are above common equity holders in terms of the order of priority in which they are paid out.
Hypothetically, in an unfavorable exit scenario, the common equity holders can be left with no residual proceeds. But while the common equity holders could be left with nothing, they are typically not at risk of owing anything to the company (i.e. negative proceeds).
The treatment of preferred equity when calculating the remaining proceeds to common equity holders is debt-like, in the sense that the preferred equity holders get paid out first before the common equity holders are entitled to any proceeds.
4. Preferred Stock Investment Returns Analysis
In the two sensitivity tables near the bottom section of our preferred equity returns model, we can see the proceeds to the firm and the MOIC based on different exit proceeds.
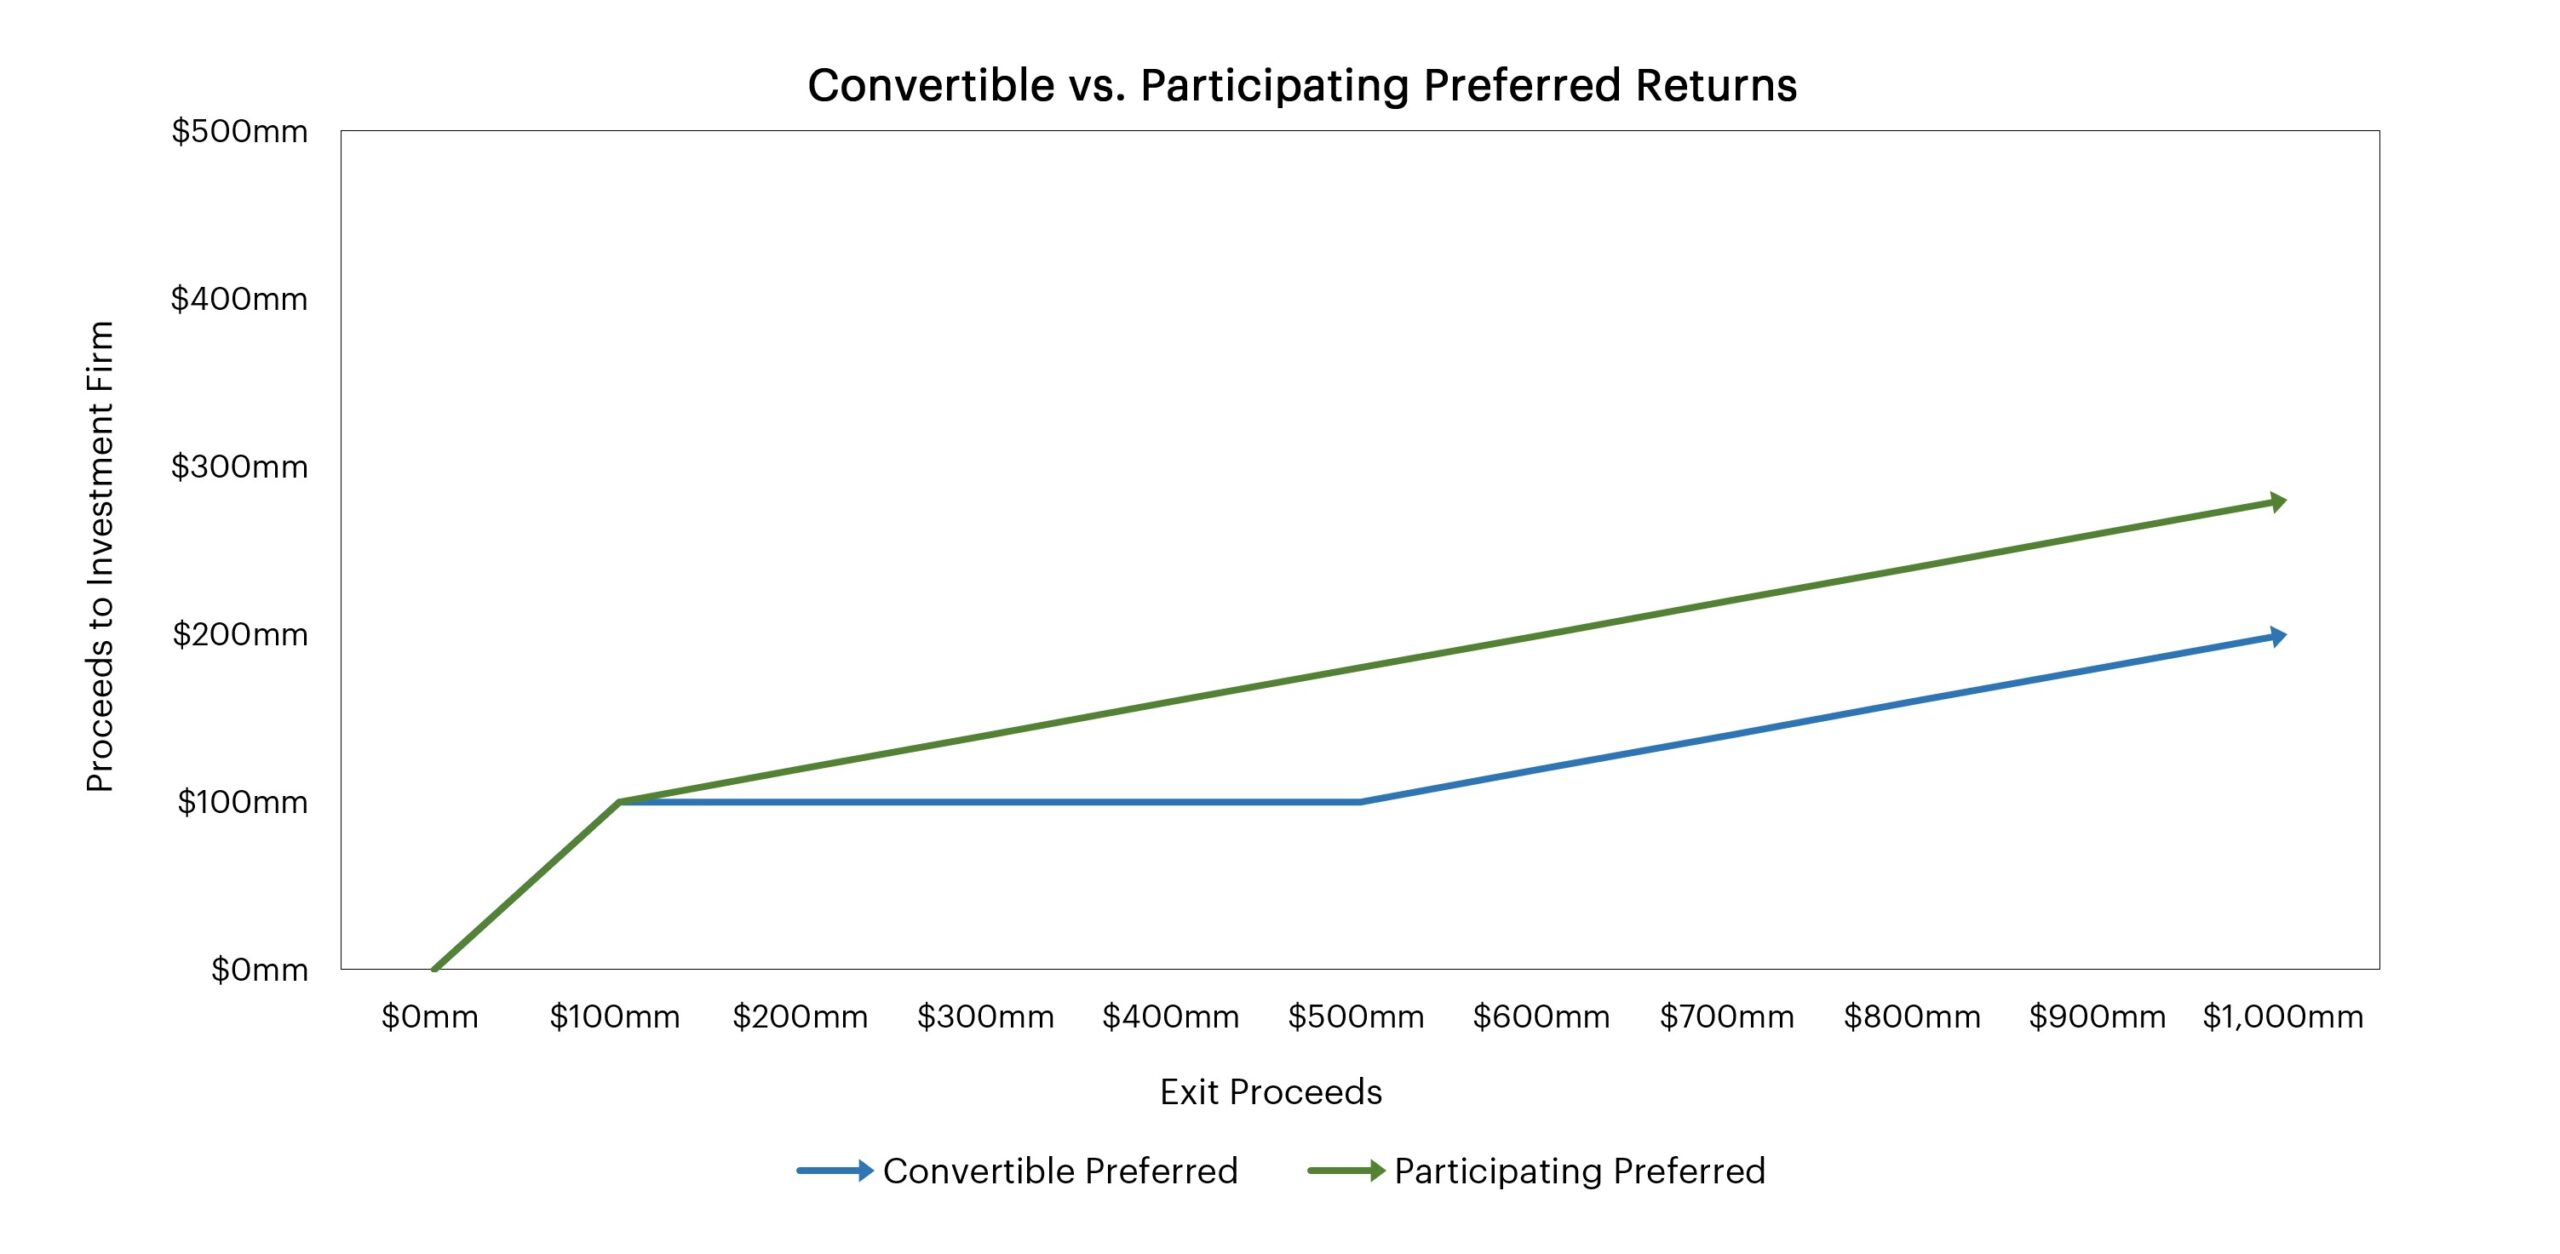
Most of the time, the returns from the participating preferred structure outpace the returns earned on the convertible preferred investments.
For that reason, companies limit the % share that preferred investors have in the proceeds attributable to common shareholders, and/or place a liquidation preference cap on the return multiple to prevent the investor from generating returns beyond a certain level (and such provisions help protect existing common shareholders from dilution).
5. Convertible vs. Participating Preferred Stock Returns Graph
In closing, we’ll illustrate the two returns from the convertible preferred and participating preferred stock investment in the graph, depicting how the convertible value remains constant at $100mm until the exit proceeds reach $500mm.

")


