
- What is Pre-Tax Income?
- How to Calculate Pre-Tax Income (EBT)
- Pre-Tax Income Formula
- How to Find Pre-Tax Income on Income Statement
- What is a Good Pre-Tax Profit?
- Effective Tax Rate vs. Marginal Tax Rate: What is the Difference?
- Pre-Tax Income Calculator
- 1. Operating Assumptions
- 2. EBIT Calculation Example
- 3. Pre-Tax Income Calculation Example
What is Pre-Tax Income?
Pre-Tax Income—or Earnings Before Taxes (EBT)—is the remaining earnings once all operating and non-operating expenses, except for taxes, have been accounted for.
- Pre-tax income, or Earnings Before Taxes (EBT), is the remaining profit after deducting operating costs (COGS, Opex) and non-operating expenses (Interest).
- Pre-tax income measures a company's residual profitability, or taxable income for bookkeeping purposes, in a given period before deducting income taxes.
- EBT facilities more practical comparisons among companies by excluding taxes, as different geographical locations may have different corporate tax rates.
- The effective tax rate is calculated as Taxes Paid divided by EBT, and the historical percentage is applied in the forecast.
How to Calculate Pre-Tax Income (EBT)
The pre-tax income line item, often used interchangeably with earnings before taxes (EBT), is a measure of a company’s taxable income for a given time period.
In order to reach the pre-tax line item (EBT), the starting line item of the income statement—the company’s revenue in the period (“top-line”)—must be adjusted for the following items:
- Cost of Goods Sold (COGS)
- Operating Expenses (OpEx)
- Non-Operating Income / (Expense)
Common examples of non-core income or expenses would be interest expense and interest income, which are more related to financing and investing activities, rather than operating activities.
Therefore, a company’s interest expense and other non-core income or expenses must be subtracted from operating income (EBIT) to calculate pre-tax income.
Pre-Tax Income Formula
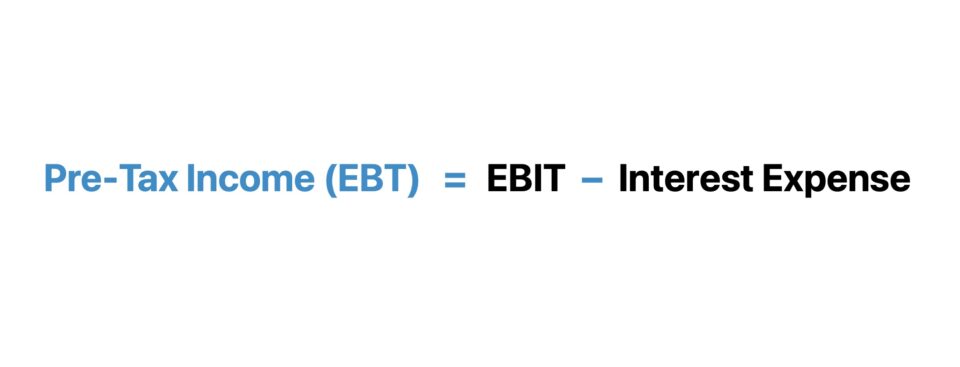
The formula for calculating the pre-tax income (EBT) is equal to operating income subtracted by interest expense.
“Pre-Tax” means that all income and expenses have been accounted for, except for taxes. Thus, pre-tax income measures a company’s profitability before accounting for any tax impact.
Once taxes are deducted from a company’s pre-tax income, you have arrived at net income (i.e. the “bottom line”).
Conversely, if given the net income value, the pre-tax income (EBT) can be calculated by adding back the tax expense.
How to Find Pre-Tax Income on Income Statement
On the 10-K of Apple (AAPL), the “Income before provision for income taxes” line item represents the pre-tax income line item.
The pre-tax income comes after other income / (expense) – i.e. non-operating items – are accounted for.
The line item that comes afterward is the “Provision for income taxes”.
Once taxes are deducted from pre-tax income, the remaining profit metric is net income (i.e. the “bottom line”).
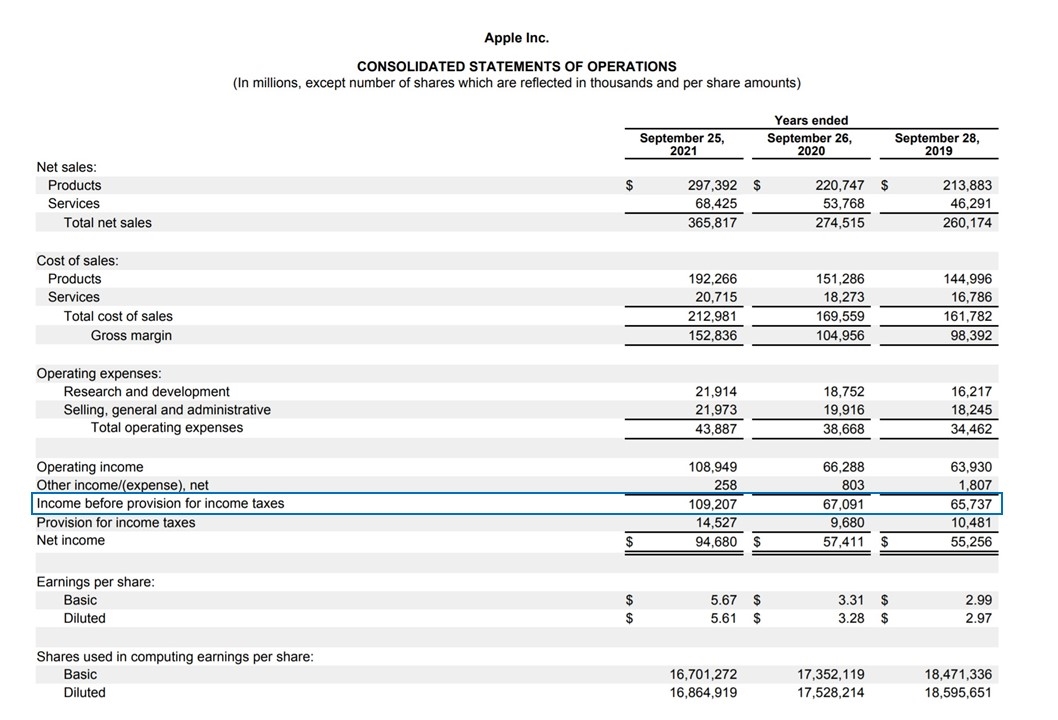
Apple Pre-Tax Income (Source: AAPL 2021 10-K)
What is a Good Pre-Tax Profit?
For any standalone profit metric, including the pre-tax profit (EBT), standardization is necessary for purposes of comparability, i.e. convert into a margin, or ratio.
The pre-tax profit margin (or “EBT margin”) represents the percentage of profits a company retains prior to paying mandatory taxes to the state and/or federal government.
To convert the result into percentage form, the resulting amount from the formula above must be multiplied by 100.
Since earnings before taxes excludes taxes, the metric makes comparisons among companies with different tax rates more practical.
For instance, the profitability of companies can deviate largely due to their geographic location, where corporate taxes could differ, as well as due to differing tax rates at the state level.
The company could also have items such as tax credits and net operating losses (NOLs) that can affect its effective tax rate – which further makes comparisons of comparable companies’ net incomes less accurate.
In the context of relative valuation, the primary limitation to pre-tax profit is that the metric is still impacted by discretionary financing decisions.
Despite the removal of tax differences, the EBT metric is still skewed by different capital structures (i.e. interest expense) within the peer group, so a company could show higher profits than a peer due to not having any debt or associated interest expense.
Hence, EBITDA and EBIT are the most widespread valuation multiples – i.e. EV/EBITDA and EV/EBIT – in practice, as both metrics are independent of capital structure decisions and taxes.
The pre-tax income metric is most commonly used for calculating the taxes paid, rather than for peer comparisons.
Effective Tax Rate vs. Marginal Tax Rate: What is the Difference?
For purposes of building projection models, the chosen tax rate can be one of the following:
- Effective Tax Rate (%) → The effective tax rate represents the percentage of a company’s taxes paid relative to its taxable income (EBT). The effective tax rate for historical periods can be calculated by dividing the taxes paid by the pre-tax income (or earnings before tax), as shown below.
- Marginal Tax Rate (%) → On the other hand, the marginal tax rate is the taxation percentage on the last dollar of a company’s taxable income. The amount owed in taxes is largely dependent on the statutory tax rate of the governing jurisdiction, not just the company’s taxable income, i.e. the tax rate adjusts based on the tax bracket the company falls under.
The formula to compute the effective tax rate is as follows.
The effective and marginal tax rates differ because the effective tax rate uses pre-tax income (EBT) from the income statement, which is calculated under accrual accounting standards.
Since there can be differences between the earnings before taxes (EBT) amount recorded on the income statement and the taxable income reported on tax filing, the tax rates are more often than not different.
But in either case, the tax rate is multiplied by pre-tax income (EBT) to determine the taxes paid in the period, which is necessary to arrive at the net income line item (the “bottom line”).
Pre-Tax Income Calculator
We’ll now move on to a modeling exercise, which you can access by filling out the form below.
1. Operating Assumptions
For our illustrative scenario, suppose we’re calculating a company’s pre-tax profit (EBT) with the following financial profile.
Income Statement Financial Data
- Revenue = $100 million
- COGS = $50 million
- Operating Expenses = $20 million
- Interest Expense, net = $5 million
2. EBIT Calculation Example
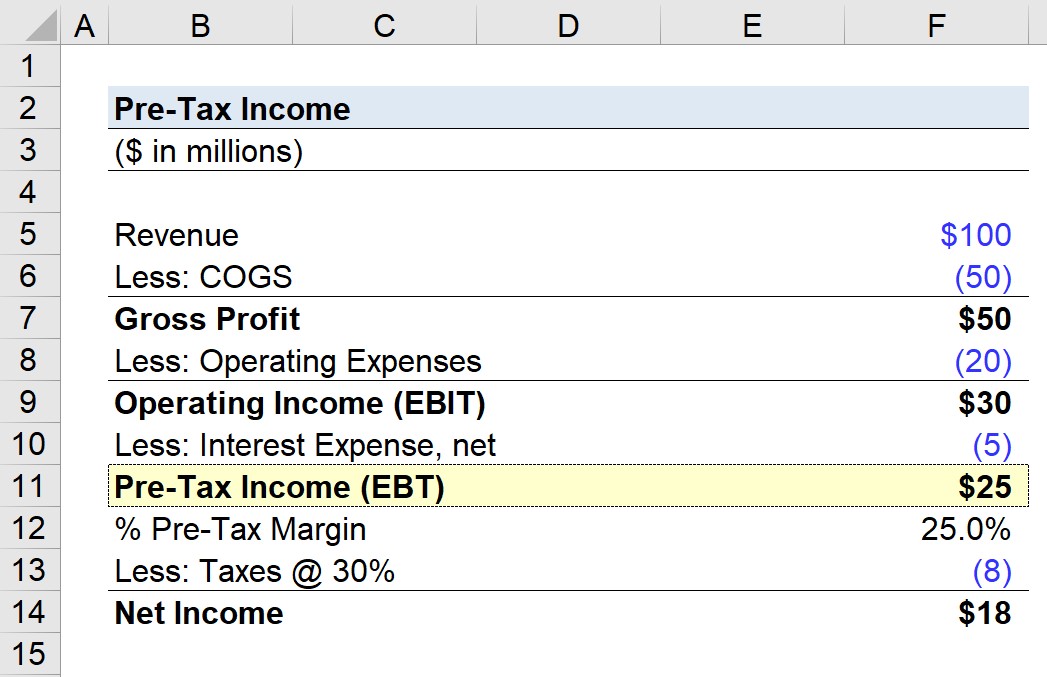
Using the assumptions provided, gross profit is $50 million, whereas operating income (EBIT) is $30 million.
- Gross Profit = $100 million – $50 million = $50 million
- Operating Income (EBIT) = $50 million – $20 million = $30 million
Furthermore, gross margin and operating margin are 50% and 30%, respectively.
- Gross Margin (%) = $50 million / $100 million = .50, or 50%
- Operating Margin (%) = $30 million / $100 million = .30, or 30%
3. Pre-Tax Income Calculation Example
In the final part of our exercise, we’ll calculate the company’s pre-tax income, which is equal to operating income (EBIT) minus the interest expense.
- Pre-Tax Income = $30 million – $5 million = $25 million
The pre-tax margin, or EBT margin, can be calculated by dividing our company’s earnings before taxes (EBT) by revenue.
- Pre-Tax Margin (%) = $25 million ÷ $100 million = 25%
From there, the final step before arriving at net income is to multiply the pre-tax income by the 30% tax rate assumption – which comes out to $18 million.

Everything You Need To Master Financial Modeling
Enroll in The Premium Package: Learn Financial Statement Modeling, DCF, M&A, LBO and Comps. The same training program used at top investment banks.
Enroll Today


