
- What is P/E Ratio?
- How to Calculate P/E Ratio
- P/E Ratio Formula
- Price-Earnings Ratio Calculation Example
- What is a Good P/E Ratio?
- What are the Pros and Cons of Price-to-Earnings Ratio?
- Trailing vs. Forward P/E Ratio: What is the Difference?
- How Does Debt Impact Price-to-Earnings Ratio?
- P/E Ratio Calculator
- 1. Operating Assumptions
- 2. Diluted Earnings Per Share Calculation (EPS)
- 3. P/E Ratio Calculation Example
What is P/E Ratio?
The P/E Ratio—or “Price-Earnings Ratio”—is a common valuation multiple that compares the current stock price of a company to its earnings per share (EPS).
Simply put, the P/E ratio of a company measures the amount that investors in the open markets are willing to pay for a dollar of the company’s net income as of the present date.
- The P/E ratio is an abbreviation for "Price-to-Earnings Ratio" that measures the amount that investors in the market are willing to pay for a dollar of the company's net income as of the present date.
- The P/E ratio is a valuation multiple that compares the current stock price of a company to its earnings per share (EPS).
- The price-earnings ratio can also be calculated by dividing a company's market cap (or equity value) by its net income.
- A higher price-earnings ratio implies the company is potentially overvalued, while a lower price-to-earnings ratio suggests the company is undervalued.
- The price-to-earnings ratio cannot be used to analyze unprofitable companies, since a negative P/E ratio is not meaningful.
How to Calculate P/E Ratio
The P/E ratio, often referred to as the “price-earnings ratio”, measures a company’s current stock price relative to its earnings per share (EPS).
The relative valuation method (“comps”) estimates the fair value of a company by comparing a standardized ratio to its peer group, or competitors operating in the same industry or sector.
The price-to-earnings ratio (P/E) of a company is compared to its peer group, comprised of comparable companies, to arrive at the implied equity value.
If you’re evaluating a potential investment, comparisons to other companies in the same or an adjacent industry can be a practical method to determine whether a stock is currently undervalued or overvalued by the market.
For example, the price-to-earnings (P/E) ratio provides the implied valuation of a company based on its current earnings, or accounting profitability.
The process of calculating the price-to-earnings (P/E) ratio consists of three steps:
- Step 1 ➝ Determine the Share Price (or Equity Value)
- Step 2 ➝ Calculate the Earnings Per Share (or Net Income)
- Step 3 ➝ Divide the Share Price by the EPS (or Divide Equity Value by Net Income)
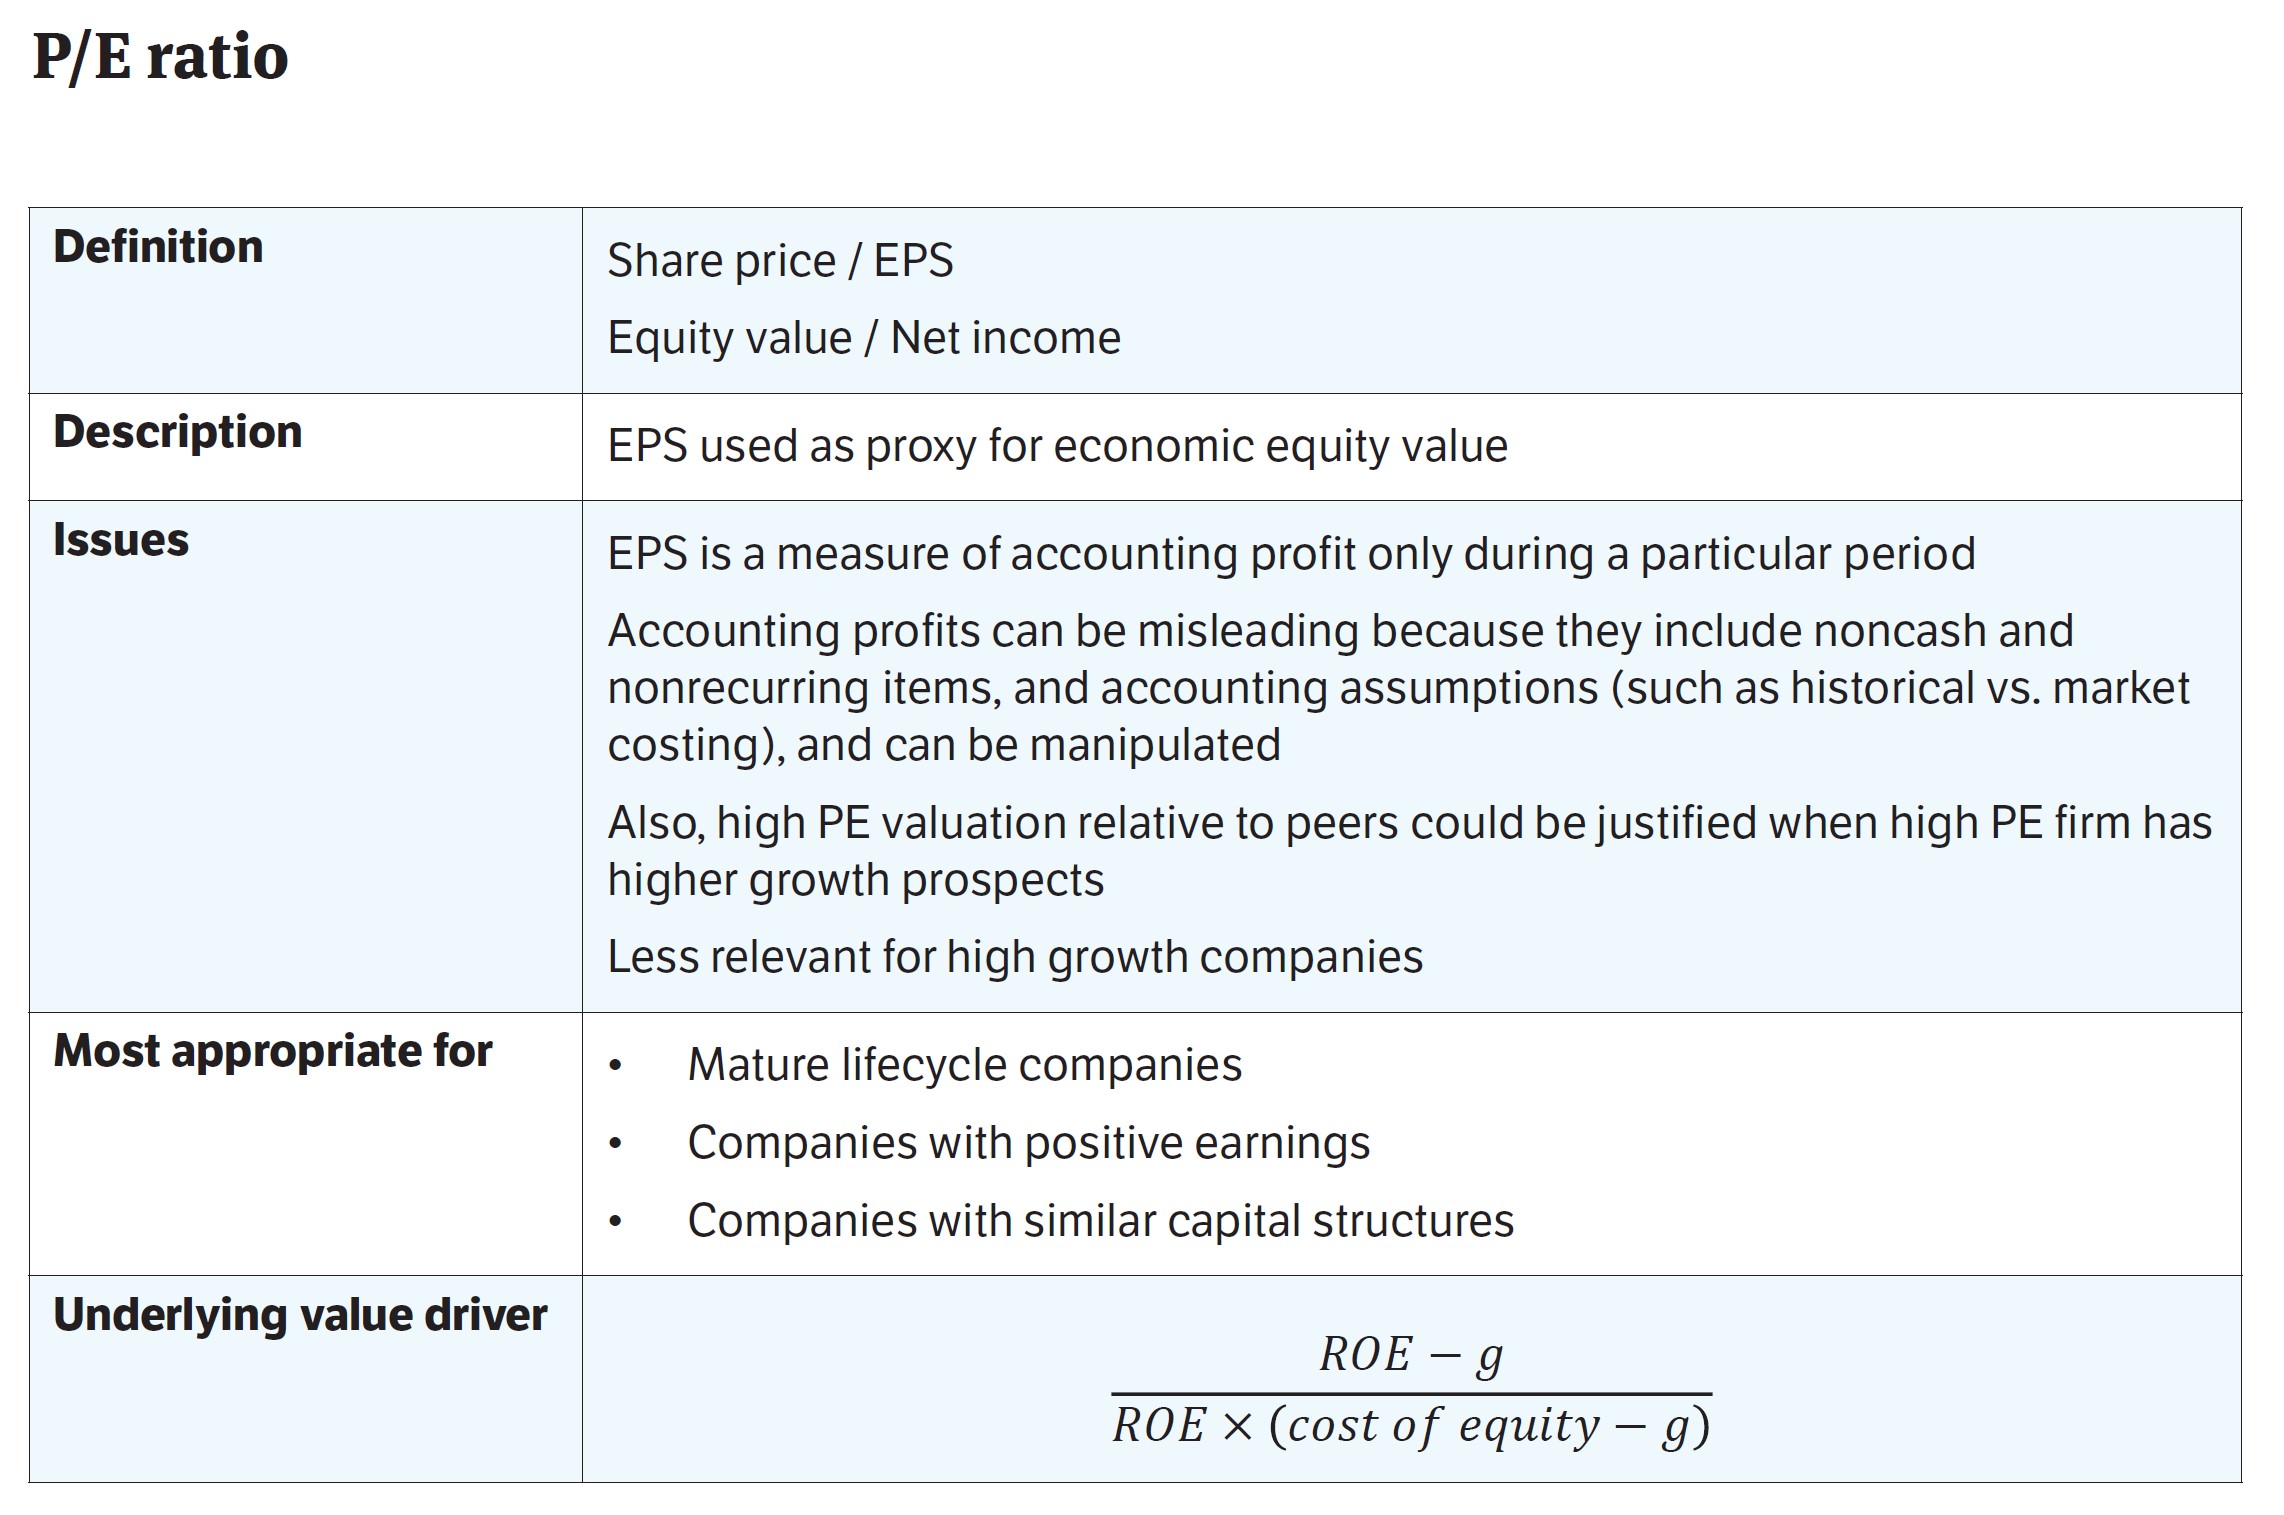
Price Earnings Summary Chart
Learn More → Price-Earnings (P/E Ratio) Definition (Source: SEC.gov)
P/E Ratio Formula
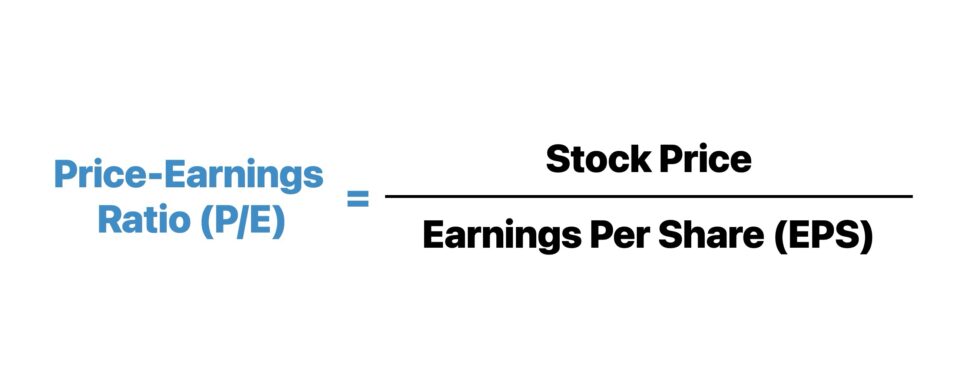
The formula for calculating the P/E ratio—or price-earnings ratio—is equal to the current stock price divided by earnings per share (EPS).
Where:
- Earnings Per Share (EPS) = Net Income ÷ Total Number of Diluted Shares Outstanding
To account for the fact that a company could’ve issued potentially dilutive securities in the past, the diluted share count should be used — otherwise, the EPS figure is likely to be overstated.
The market price of the shares issued by a company tells you how much investors are currently willing to pay for ownership of the shares.
When combined with EPS, the P/E ratio helps gauge if the market price accurately reflects the company’s earnings (or earnings potential).
The price-to-earnings ratio can also be calculated by dividing the company’s equity value (i.e. market capitalization) by its net income.
While the two formulas we’ve discussed thus far are conceptually the same, the answers usually vary marginally from one another due to a minor discrepancy:
- Earnings Per Share (EPS) → The earnings per share (EPS) metric is calculated by using the weighted average number of shares (i.e. beginning and ending period average).
- Net Income → In contrast, net income is the accounting profitability of a company that measures operating performance across a period of time.
Price-Earnings Ratio Calculation Example
Suppose a publicly-traded company’s latest closing share price is $20.00, and its diluted EPS in the last twelve months (LTM) is $2.00.
The company’s price-to-earnings ratio is 10x, which we determined by dividing its current stock price by its diluted earnings per share (EPS).
- Price-to-Earnings Ratio (P/E Ratio) = $20.00 Share Price ÷ $2.00 Diluted EPS = 10.0x
Therefore, the market is currently willing to pay $10 for each dollar of earnings generated by the company.
Said differently, it would take approximately 10 years of accumulated net earnings to recoup the initial investment.
What is a Good P/E Ratio?
Determining whether a company is undervalued, overvalued, or correctly priced by the market requires more in-depth analysis and benchmarking to a variety of valuation multiples of comparable peers.
So, is a higher or lower P/E ratio better?
- High P/E Ratio → A higher ratio relative to peers can be interpreted as a potential sign that the shares of the companies are overvalued — or that investors are projecting the company’s earnings to rise.
- Low P/E Ratio → A lower ratio relative to peers suggests the company is either undervalued or that investors expect its earnings to decline, which tends to coincide with declining growth as the company reaches maturity.
While the P/E ratio is inadequate by itself, it can be a very useful metric when the situation is appropriate and if supplemented with other metrics, namely when compared to the target company’s industry peers.
Learn More → Price Earnings Ratios by Sector (Source: Damodaran)
What are the Pros and Cons of Price-to-Earnings Ratio?
Using a P/E ratio is most appropriate for mature, low-growth companies with positive net earnings.
The price-to-earnings ratio can be rather meaningless for early-stage companies that are barely profitable or yet profitable.
The P/E ratio would be a significantly large multiple and not be comparable to industry peers (i.e. as a complete outlier) — or even come out to be a negative number. Either way, the P/E ratio would not be meaningful or practical for comparison purposes.
The price-to-earnings ratio uses EPS (or net income) in its formula, which comes with two major pitfalls:
- Accrual Accounting → EPS and net income are measures of profit under accrual accounting and are thereby prone to differences caused by management discretion (e.g. depreciation, useful life assumptions)
- Skewed by Growth → For high-growth companies, the P/E ratio is likely going to be on the higher end, which does NOT necessarily mean that the company is overvalued — instead, the valuation multiple could very well be reasonably justified (i.e. investors expect the company to increase its profitability in the future)
One shortcoming of the P/E ratio is the neglect of the company’s growth potential. Therefore, the price/earnings to growth (PEG) ratio is a modified version of the price-to-earnings (P/E) ratio, where the earnings growth projections is considered.
But to reiterate, performing diligence on a potential stock requires a blend of qualitative and quantitative analysis to support the investment thesis, rather than one financial ratio to measure a company’s financial position and long-term outlook.
Trailing vs. Forward P/E Ratio: What is the Difference?
There are two common variations of the P/E ratio:
- Trailing P/E Ratio → The price-to-earnings ratio is calculated using the earnings from the actual performance in the last twelve months (LTM).
- Forward P/E Ratio → The price-to-earnings ratio is calculated using the upcoming, forecasted net earnings of a company.
How Does Debt Impact Price-to-Earnings Ratio?
The price-to-earnings ratio of similar companies could vary significantly due to differences in financing (i.e. leverage).
If a company borrows more debt, the EPS (denominator) declines from the higher interest expense. The extent of the share price impact largely depends on how the debt is used.
For example, increased risk and interest expense could cause the price-to-earnings ratio to decline, while well-structured reinvestment for growth could cause the P/E ratio to increase and offset the downsides of using debt.
For companies, the reliance on more debt financing adds more risk to equity investors, especially considering their position at the bottom of the capital structure.
If there are two identical companies, investors are more likely to value the highly levered company at a lower P/E ratio, given the higher leverage-related risks.
In practice, the P/E ratio is a widely used valuation multiple but has its limitations in being affected by differing reporting standards, growth rates, and the capital structure of the companies being compared.
Therefore, similar to all other financial metrics, the price-to-earning ratio (P/E ratio) should not be used alone to make investment decisions.
P/E Ratio Calculator
We’ll now move on to a modeling exercise, which you can access by filling out the form below.
1. Operating Assumptions
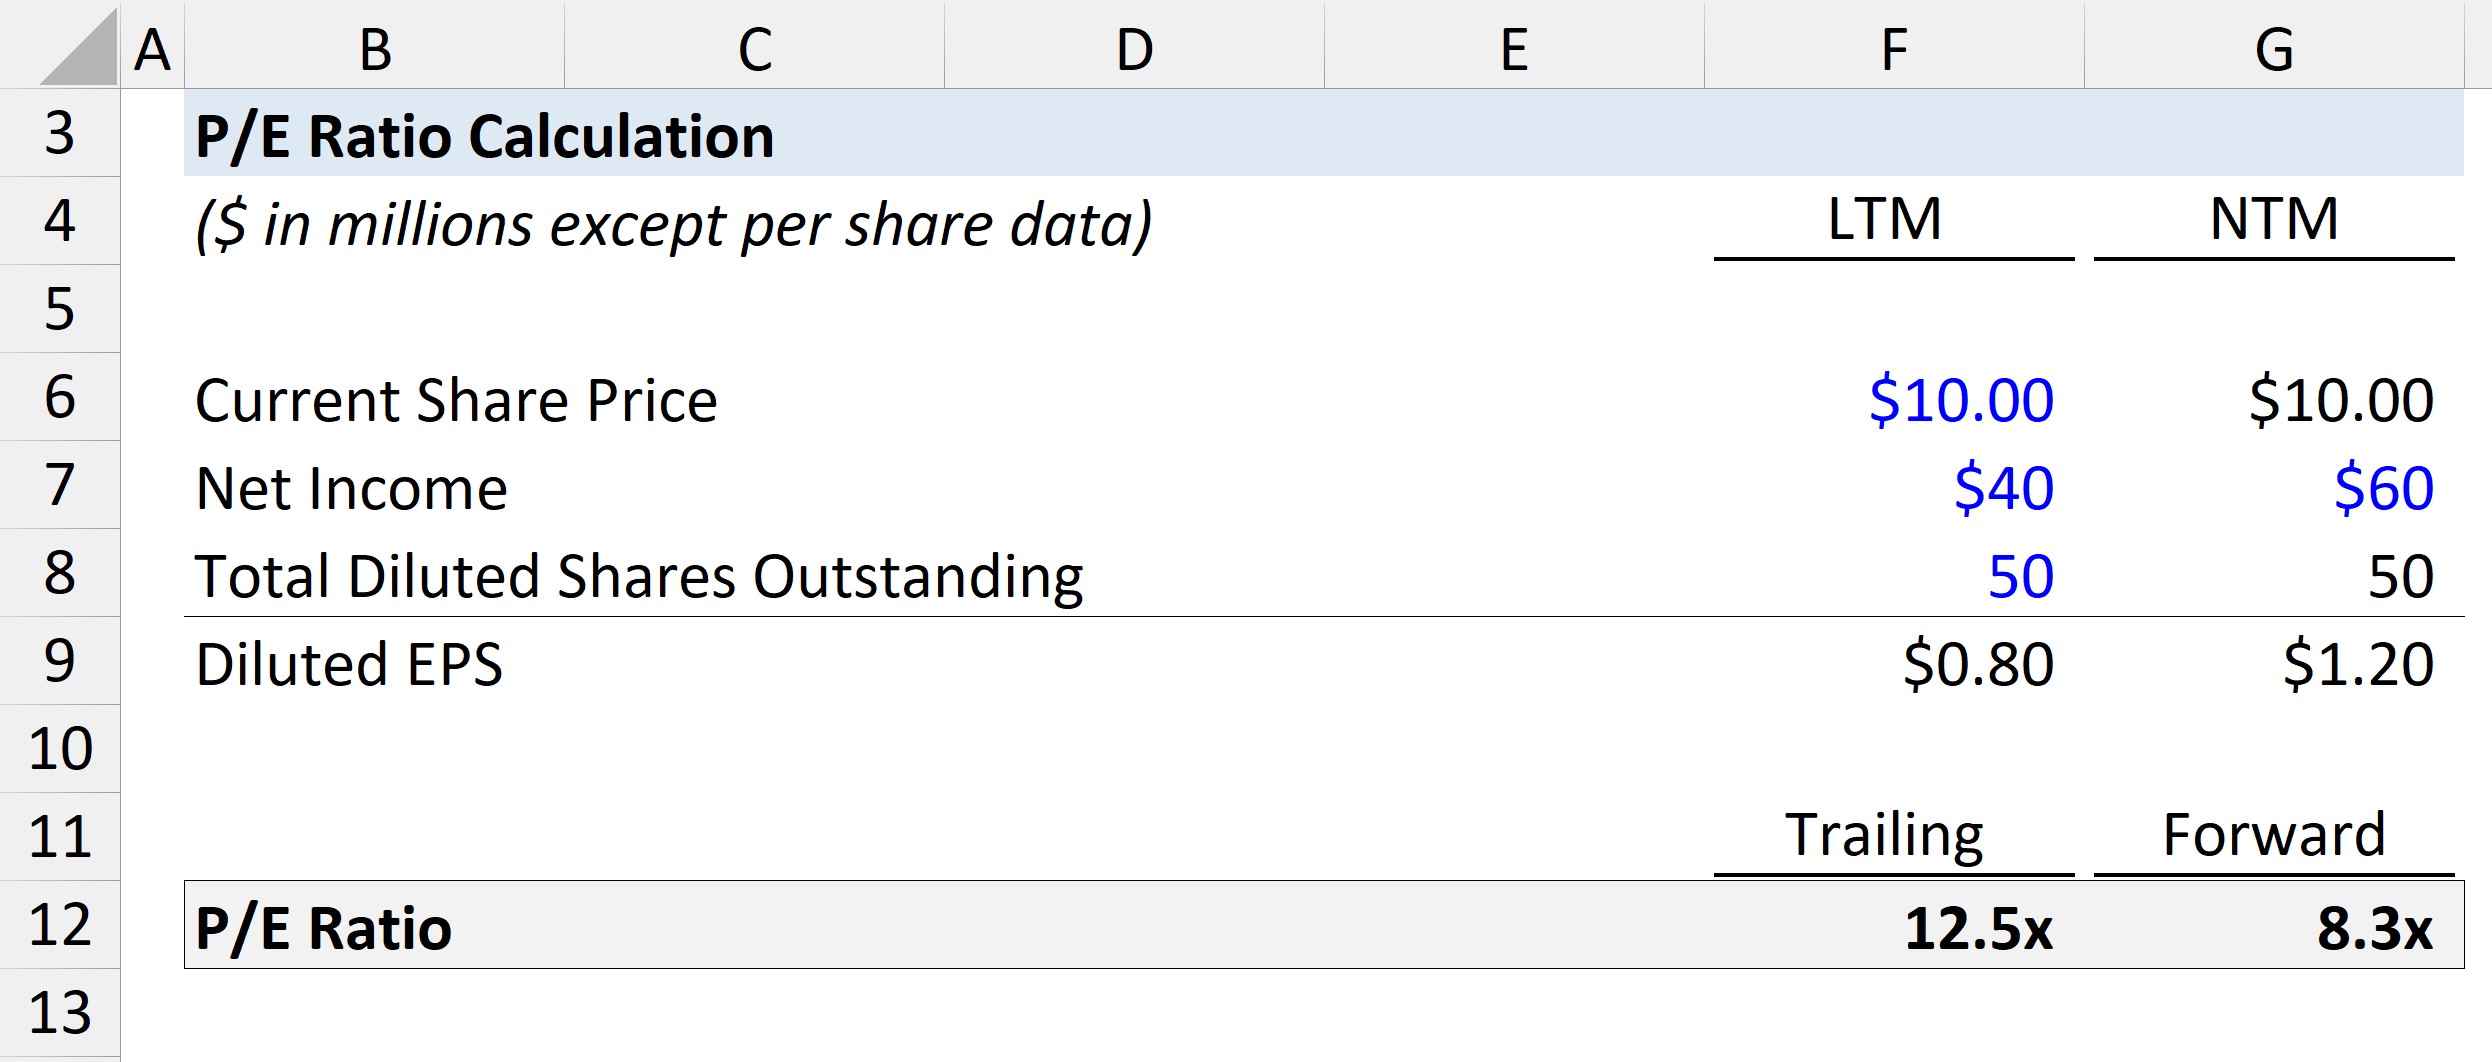
Suppose we’re tasked with calculating the price-to-earnings ratio of a hypothetical company, given the following assumptions:
- Latest Closing Share Price = $10.00
- Last Twelve Months (LTM) Net Income = $40mm
- Next Twelve Months (NTM) Net Income = $60mm
- Total Diluted Shares Outstanding = 50m — Both in LTM and NTM
2. Diluted Earnings Per Share Calculation (EPS)
In the next step, one input for calculating the P/E ratio is diluted EPS, which we’ll compute by dividing net income in both periods (i.e. LTM and NTM basis) by the diluted share count.
- Diluted EPS (LTM) = $40m Net Income ÷ 50mm Shares = $0.80
- Diluted EPS (NTM) = $60m Net Income ÷ 50mm Shares = $1.20
3. P/E Ratio Calculation Example
Next, we can divide the latest closing share price by the diluted EPS we just calculated in the prior step.
Upon doing so, we arrive at 12.5x on the trailing basis and 8.3x on the forward basis.
- Trailing P/E Ratio = $10.00 Share Price ÷ $0.80 Diluted EPS = 12.5x
- Forward P/E Ratio = $10.00 Share Price ÷ $1.20 Diluted EPS = 8.3x

Everything You Need To Master Financial Modeling
Enroll in The Premium Package: Learn Financial Statement Modeling, DCF, M&A, LBO and Comps. The same training program used at top investment banks.
Enroll Today
")
")
")

