
- What are Operating Expenses?
- How to Calculate Operating Expenses
- What are Examples of Operating Expenses?
- How to Find Operating Expenses on Income Statement
- How Does OpEx Impact EBIT and Operating Margin?
- Operating Expenses Calculator
- 1. Income Statement Assumptions
- 2. Operating Expenses Calculation Example
- 3. Operating Expenses Forecast
What are Operating Expenses?
Operating Expenses (OpEx) represent the indirect costs incurred by a business to continue running its day-to-day operations. While not directly tied to the revenue generated from the products/services, operating expenses are an essential part of a company’s core operations.
How to Calculate Operating Expenses
Operating expenses (OpEx) are associated with the core operations of a company but do not directly contribute to the production of the products or services sold.
Unique to operating expenses, most costs classified as OpEx are fixed costs, which means they are not directly linked to revenue.
Instead, operating expenses like SG&A remain relatively constant regardless of production volume.
For example, the rent expense for an office is stated on the contract with the building landlord and does not fluctuate based on revenue performance.
However, note that not all OpEx are fixed costs, as an item like office supplies can be viewed as more of a variable cost since more purchases would be made if production levels were higher.
What are Examples of Operating Expenses?
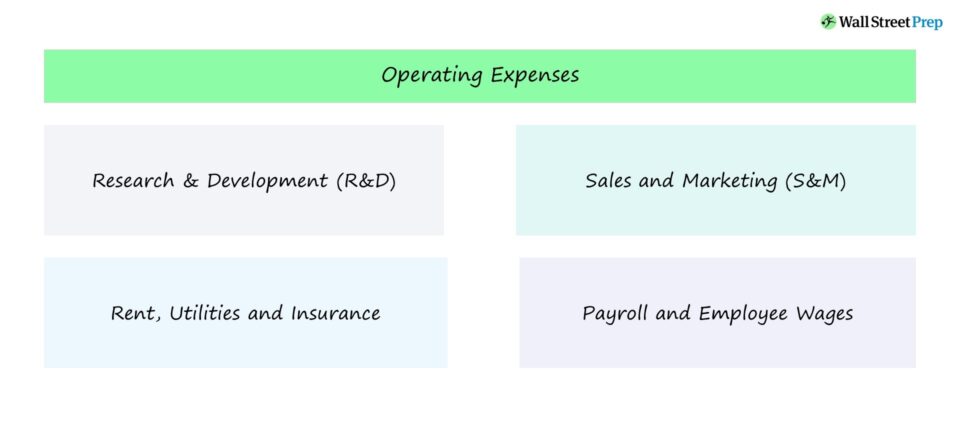
The most common examples of operating expenses incurred by companies are listed here:
OpEx Examples
- Research & Development (R&D)
- Sales and Marketing (S&M)
- Selling, General and Administrative (SG&A)
- Payroll and Employee Wages
- Rent and Utilities
- Travel and Vehicle Expenses
- Insurance
- Office Supplies
How to Find Operating Expenses on Income Statement
On the income statement, the section for operating expenses can be found below gross profit and above operating income (EBIT).
Occasionally, OpEx can be consolidated into a single line item, but the standard layout is for the expenses to be broken out into multiple line items.
For example, Apple (AAPL) placed “Research & Development” and “Selling, General & Administrative” expenses into separate buckets.
The sum of the R&D and SG&A expenses equals the total operating expenses incurred by Apple (AAPL) for each year.
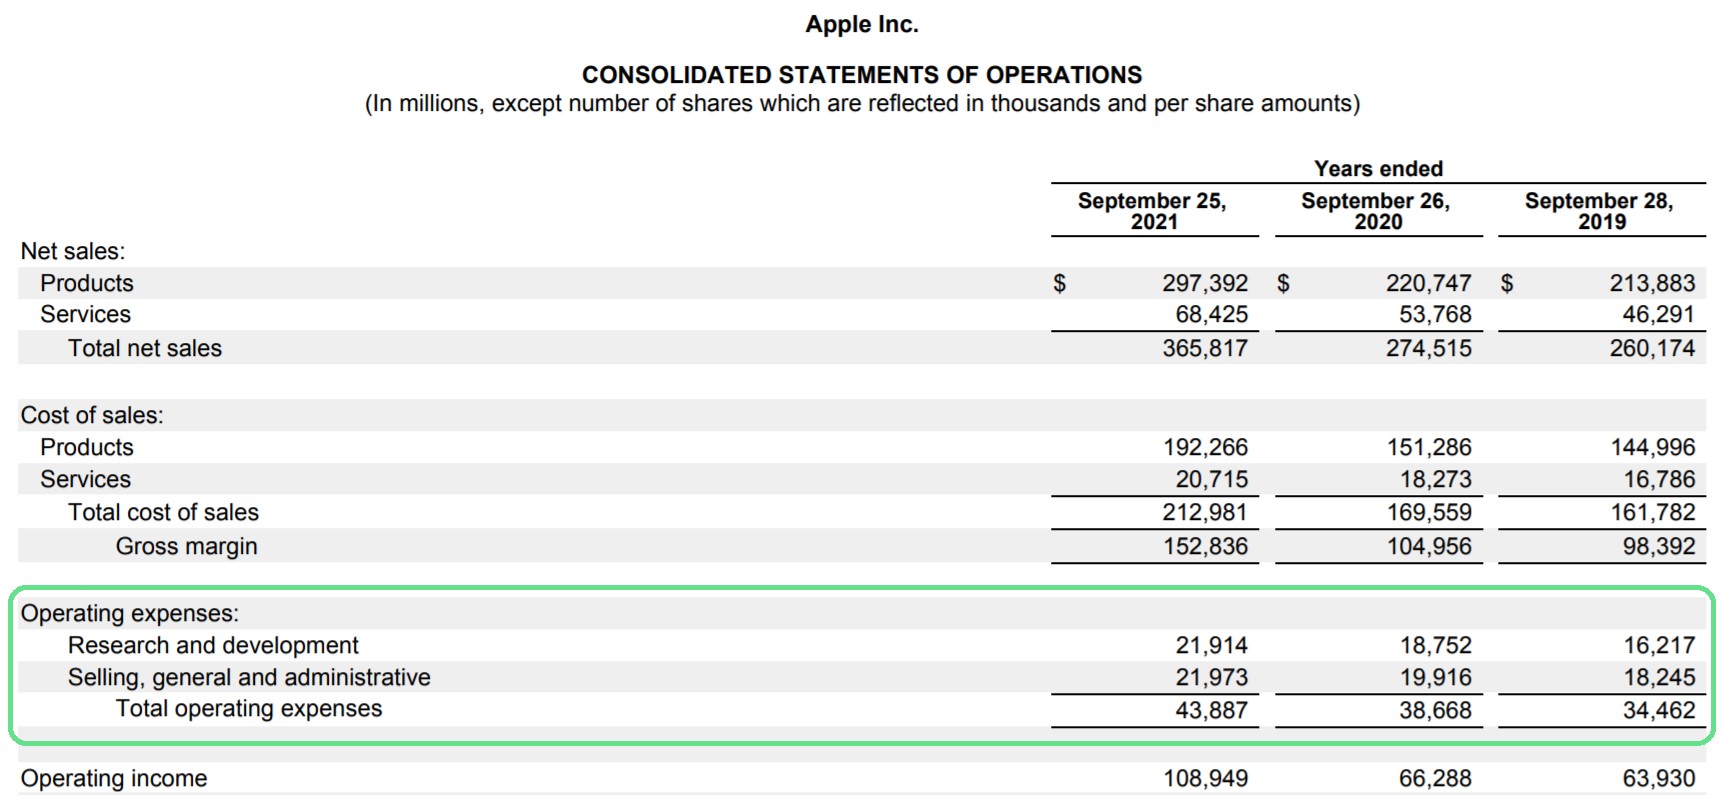
Apple Operating Expenses (Source: 2020 10-K)
Operating expenses are paid for using gross profits, which are the earnings once COGS has been subtracted.
How Does OpEx Impact EBIT and Operating Margin?
By deducting operating expenses from gross profit, the operating profit (EBIT) can be calculated.
Since operating income considers operating costs (i.e. COGS and OpEx), it represents the cash flow from core operations before accounting for other non-core sources of income/expenses.
That said, management should strive to be more efficient and maintain reasonable levels of operating costs, especially because OpEx is a significant component of the break-even point of a company.
Operating Expenses Calculator
We’ll now move to a modeling exercise, which you can access by filling out the form below.
1. Income Statement Assumptions
In our illustrative example, our company has the following financial data as of Year 0.
Income Statement Data (Year 0)
- Revenue = $125 million
- Cost of Goods Sold (COGS) = $60 million
- Selling, General & Administrative (SG&A) = $20 million
- Research & Development (R&D) = $10 million
2. Operating Expenses Calculation Example
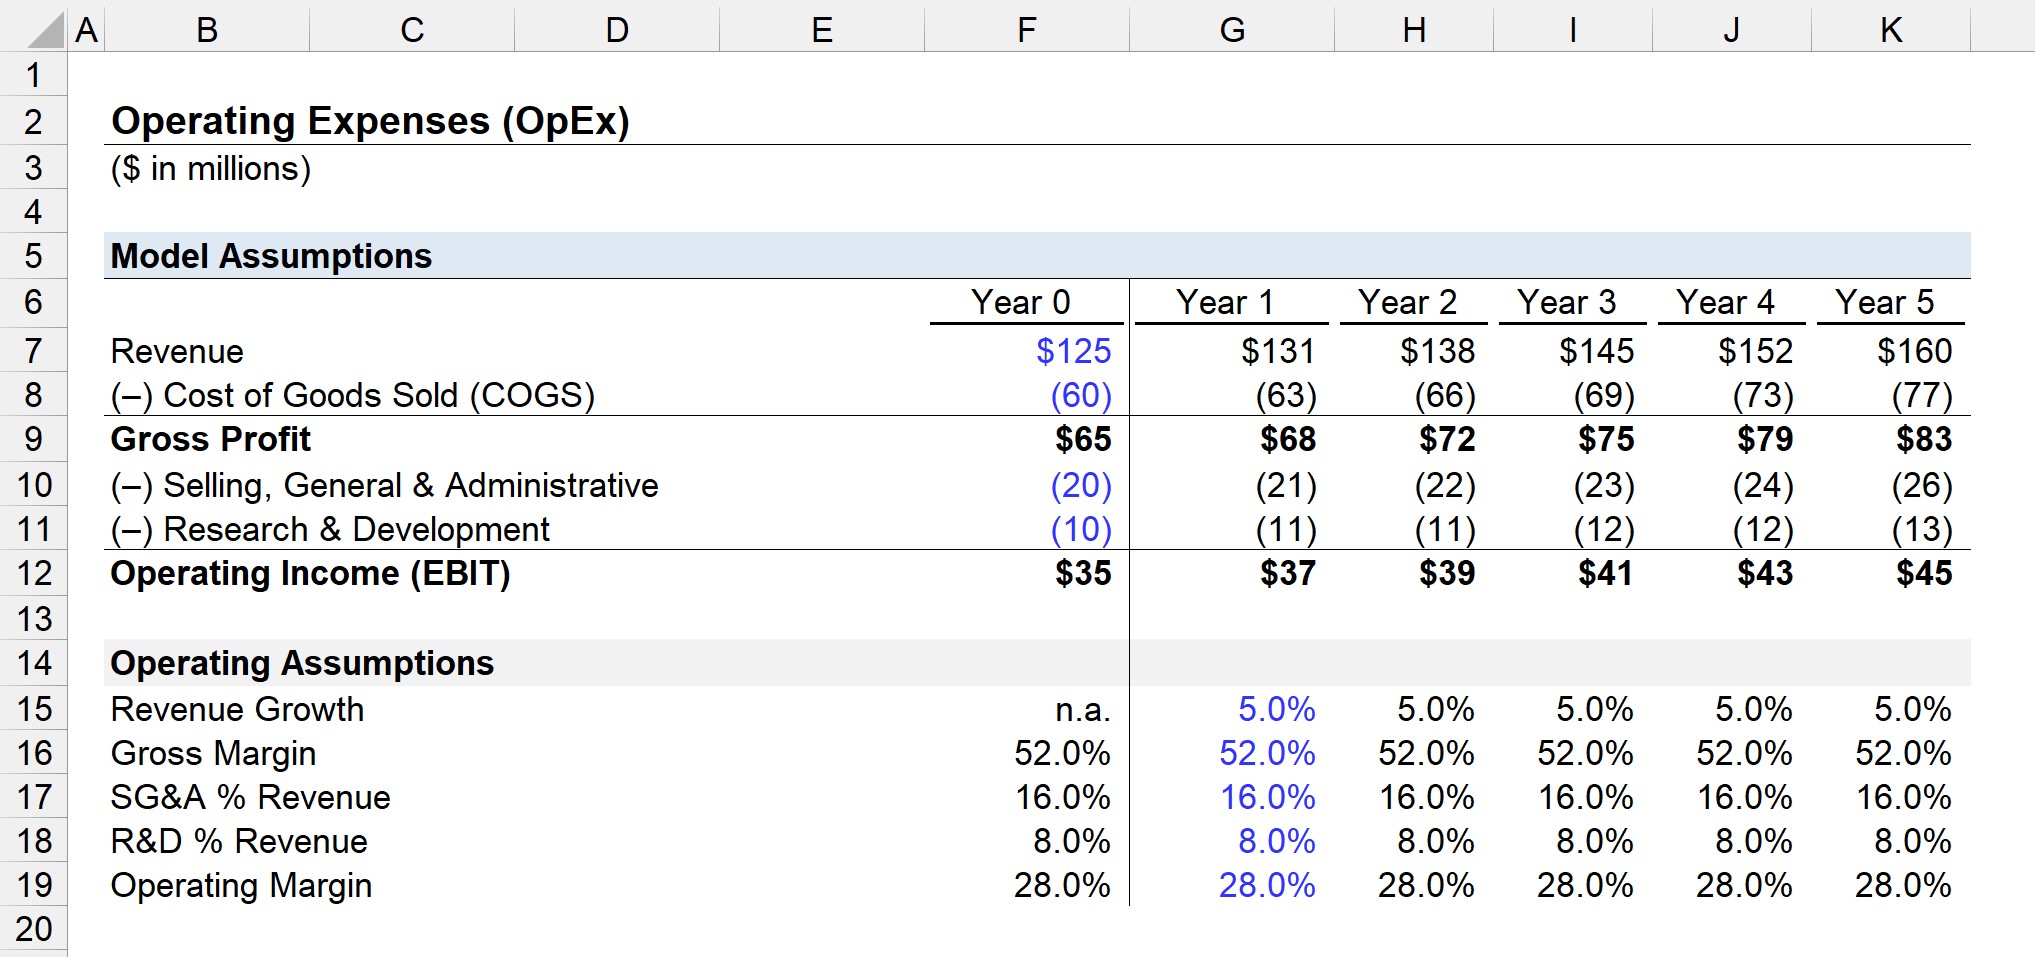
Given the assumptions above, the Year 0 gross profit is equal to $65 million, and the operating income is $35 million.
- Gross Profit = $125m – $60m = $65m
- Operating Income (EBIT) = $65m – $20m – $10m = $35m
The $30 million in SG&A and R&D are the total operating expenses of our company.
Therefore, the gross margin is 52.0% while the operating margin is 28.0% in Year 0.
3. Operating Expenses Forecast
Next, we’ll project the income statement of our company down to the operating line.
Revenue will be assumed to grow at a year-over-year growth rate of 5.0% while the gross margin remains at 52.0%.
As for our two operating expenses, SG&A and R&D, the two will remain the same percentage of revenue as Year 0.
Since SG&A as a percentage of revenue was 16.0% and R&D was 8.0% of revenue in Year 0, we’ll extend this across our assumptions section.
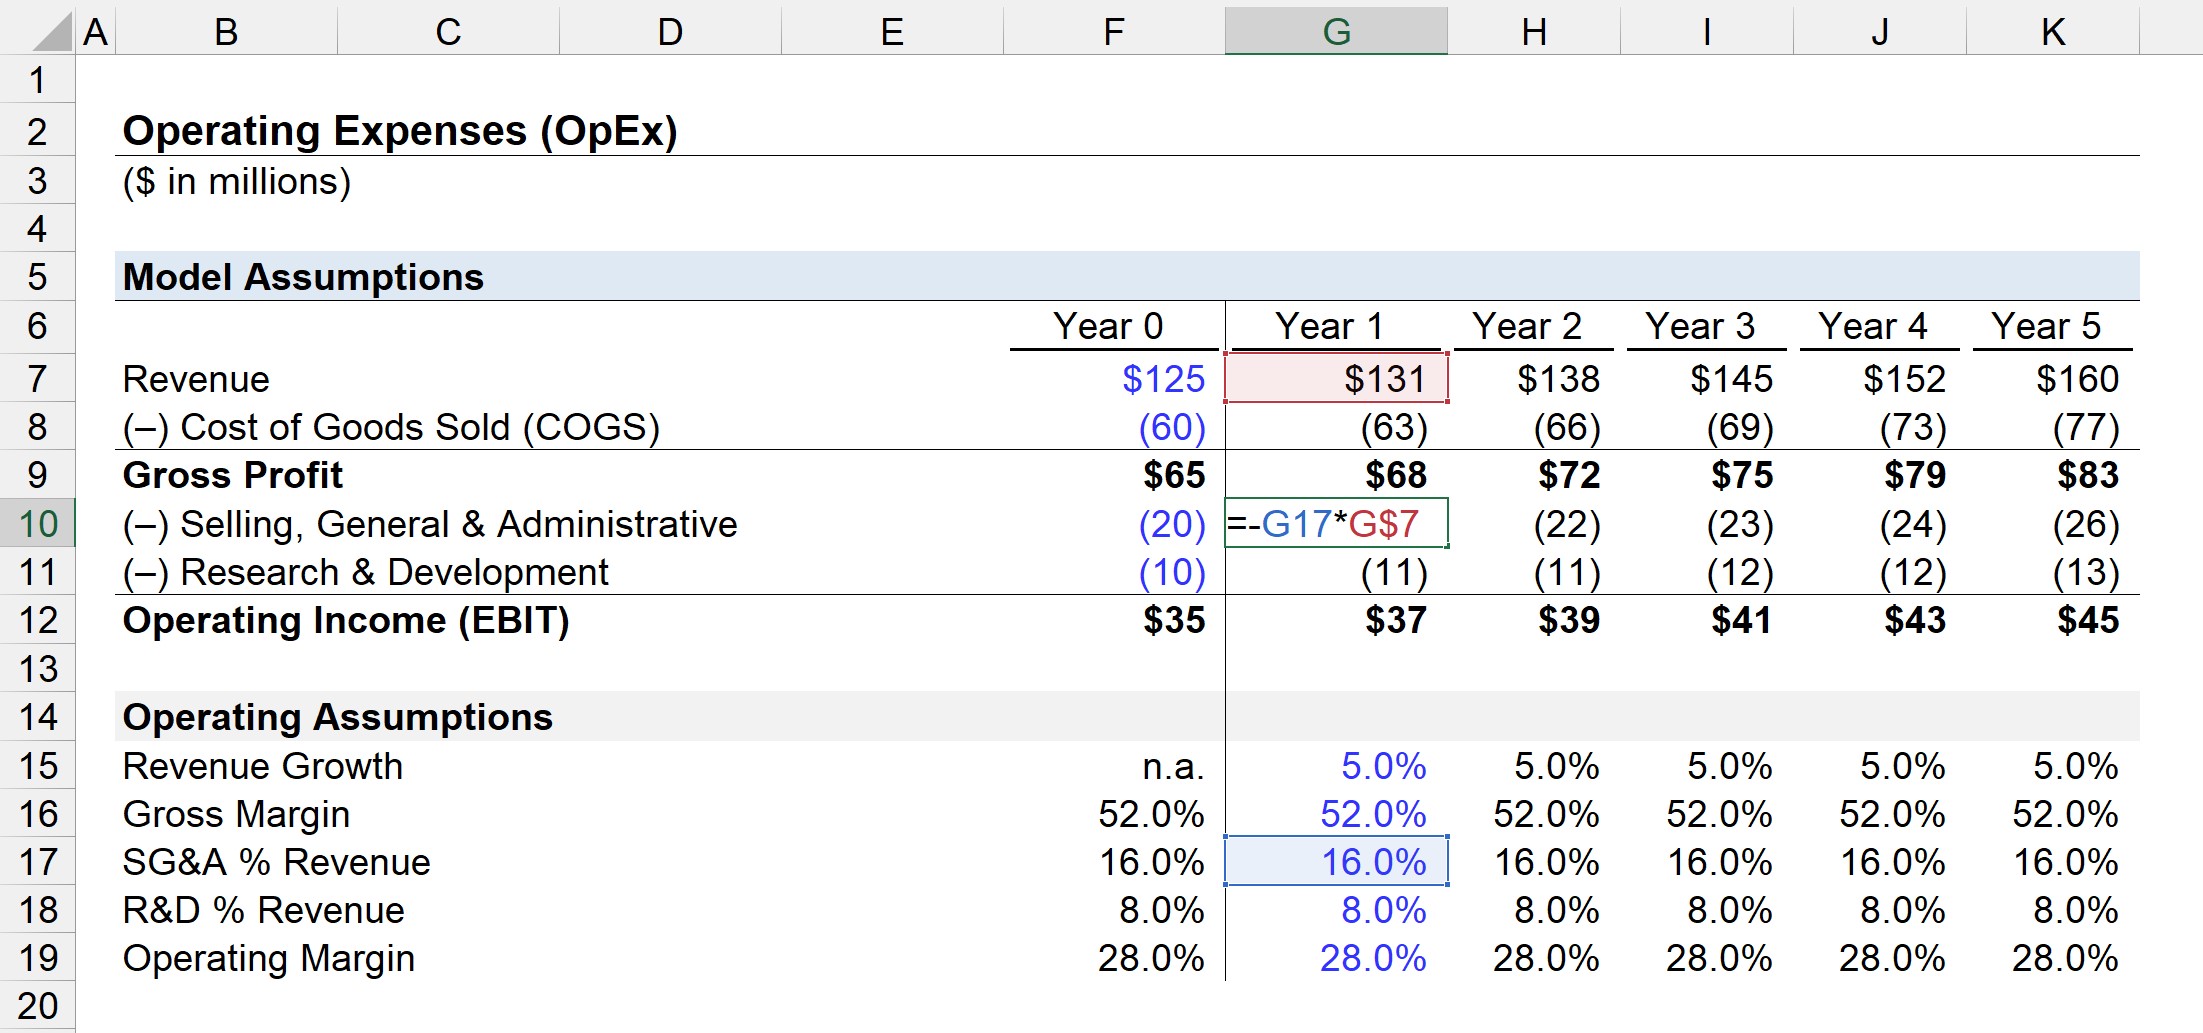
For each period, we can project the OpEx value by multiplying the “% Revenue” assumption by the revenue amount in the matching period, as shown in the screenshot above.
- SG&A Expense = (SG&A % Revenue) × Revenue
- R&D Expense = (R&D % Revenue) × Revenue
In the final step, the operating income (EBIT) can be arrived at by deducting the projected SG&A and R&D from gross profit.

Everything You Need To Master Financial Modeling
Enroll in The Premium Package: Learn Financial Statement Modeling, DCF, M&A, LBO and Comps. The same training program used at top investment banks.
Enroll Today")


