
What is Net Revenue?
The Net Revenue is the gross revenue earned by a company after adjusting for customer returns, incentive discounts, and sales allowances.
How to Calculate Net Revenue
The starting line item on the income statement is revenue (i.e. the “top line”), which measures the total monetary value of the goods and services sold by a company in a specified period.
The “Net Revenue” line item can be presented on the income statement in various forms, such as:
- Revenue, net
- Sales, net
Just as a brief review of accrual accounting, the revenue recognition principle states that sales must be recognized once “earned”, rather than after the customer’s cash payment is received.
Under accrual accounting, net revenue is recognized once “earned”, i.e. the good or service has been delivered to the customer, and compensation is expected as part of the transaction.
- Accrual Accounting → Therefore, even if a company has yet to receive cash payment for goods or services already provided, the revenue is still recorded on the income statement, with the unmet credit sale recorded as accounts receivable on the balance sheet.
- Cash-Basis Accounting → In contrast, revenue is not recognized under cash basis accounting until the company has received the actual cash payments from the customer.
Under the reporting policies established under accrual accounting, revenue must be recognized in the period it was earned, whether cash was received.
Net Revenue Formula
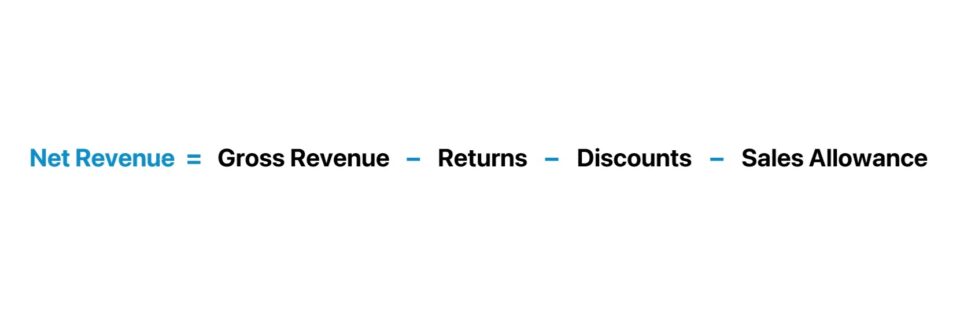
The net revenue formula subtracts customer returns, discounts, and sales allowances from gross revenue.
If applicable to the scenario, another adjustment factor to gross revenue is allowances, which are closely related to discounts.
But discounts are discretionary decisions set by the company, while a reduction in allowances is caused by an event, such as a customer receiving a defective item or mistake, i.e. a compromise reached between the buyer and seller.
How to Forecast Net Revenue
The formula for projecting net revenue can be specific to the company (and industry), but the most common approach is the “Price x Quantity” method.
- Price → The price metric can represent the average selling price (ASP), average order value (AOV), and average revenue per account (ARPA), among various types.
- Quantity → The quantity metric, on the other hand, can represent the number of orders placed, gross merchandise volume (GMV), active user count, and more.
Upon projecting a company’s gross revenue, adjustments can be made to account for the fact that there are also returns and discounts.
However, the assumptions are often made implicitly (i.e. as a projected percentage of gross revenue), rather than projecting out returns and discounts individually.
Gross vs. Net Revenue: What is the Difference?
The distinction between net revenue and gross revenue is that the latter is not adjusted for customer returns (i.e. refunds) and discounts offered as an incentive for customers to purchase the products/services.
- Gross Revenue → The gross revenue will therefore be greater than net revenue, assuming there are returns and discounts to consider, i.e. both are downward adjustments to a company’s revenue.
- Net Revenue → Since net revenue takes into account returns and discounts, it is typically viewed as a more accurate measure of a company’s sales performance, as well as the quality of its offering mix, pricing strategy, and volume of repeat purchases from customers. However, gross revenue can be more indicative of a “pure” growth metric.
Net Revenue Calculator
We’ll now move to a modeling exercise, which you can access by filling out the form below.
Net Revenue Calculation Example
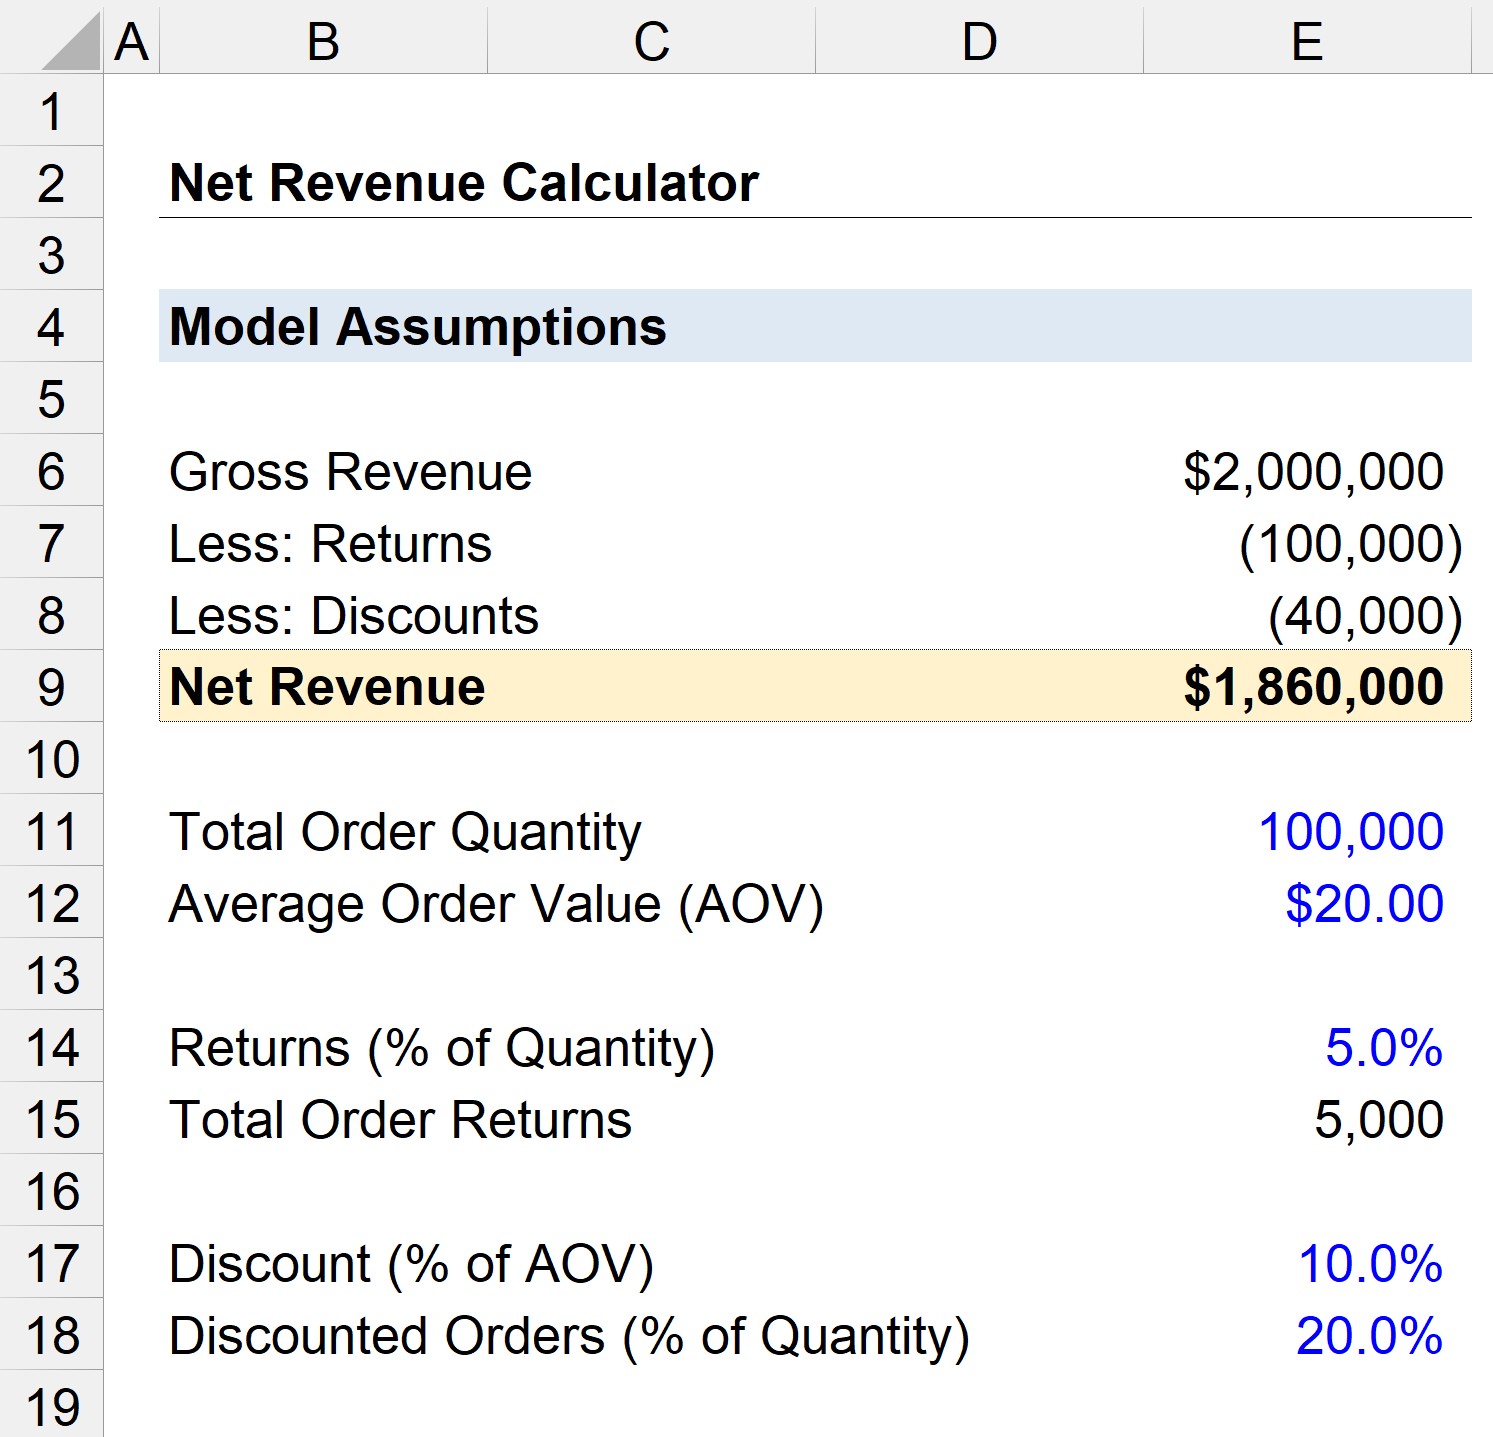
Suppose a retail company had 100k product orders in the past fiscal year, 2023.
If the average order value (AOV) of the company’s product line is $20.00, the company’s gross revenue is $2 million.
- Average Order Value (AOV) = $20.00 × 100,000 = $2 million
From our gross revenue, we must now deduct the returns from customers, as well as the discounts offered by the company.
We’ll assume that 5.0% of the total quantity was returned by customers.
- Returns (% of Quantity) = 5.0%
- Total Order Returns = 5,000 (5.0% × 100,000)
Moreover, a 10% discount was offered to certain customers, which 20% of the total orders used.
- Discount (% of AOV) = 10.0%
- Discounted Orders (% of Quantity) = 20.0%
Since we now have all the necessary assumptions, we can return to our net revenue build.
The dollar value adjustment for returns is $100,000, which we calculated by multiplying the number of returns by the average order value (AOV).
- Returns = 5,000 × $20.00 = $100,000
Next, the dollar value adjustment stemming from the discounts to customers is equal to the discount value multiplied by the number of orders placed at the 10% discount.
- Discounts = (10.0% × $20.00) × (20.0% × 100,000) = $40,000
Using the figures we calculated, we can adjust the gross revenue amount by the returns and discounts to reach a net revenue of $1.86 million.
- Net Revenue = $2 million – $100k – $40k = $1.86 million

Everything You Need To Master Financial Modeling
Enroll in The Premium Package: Learn Financial Statement Modeling, DCF, M&A, LBO and Comps. The same training program used at top investment banks.
Enroll Today


