
- What is Net Income?
- What is the Definition of Net Income?
- How to Calculate Net Income
- Net Income Formula
- How to Find Net Income on Income Statement
- What is a Good Net Income?
- Net Income vs. Cash Flow: What is the Difference?
- Net Income vs. EBIT vs. EBITDA: What is the Difference?
- How is Net Income Connected to the Balance Sheet?
- Net Income Calculator — Excel Template
- 1. Income Statement Historical Data
- 2. Net Income Calculation Example
- 3. Net Profit Margin Calculation Example
What is Net Income?
Net Income is a measure of accounting profitability, or the residual, after-tax profit of a company once all operating and non-operating costs are deducted.
The net income—or “net profit”—is recorded at the bottom of the income statement and represents the after tax profit remaining upon deducting all costs and expenses.
The net income is calculated by subtracting revenue by operating costs—such as cost of goods sold (COGS) and selling, general, and administrative (SG&A)—and non-operating costs, like interest expense and taxes.
- Net income is the residual earnings of a company after all operating costs and non-operating expenses, including taxes, have been deducted from total revenue.
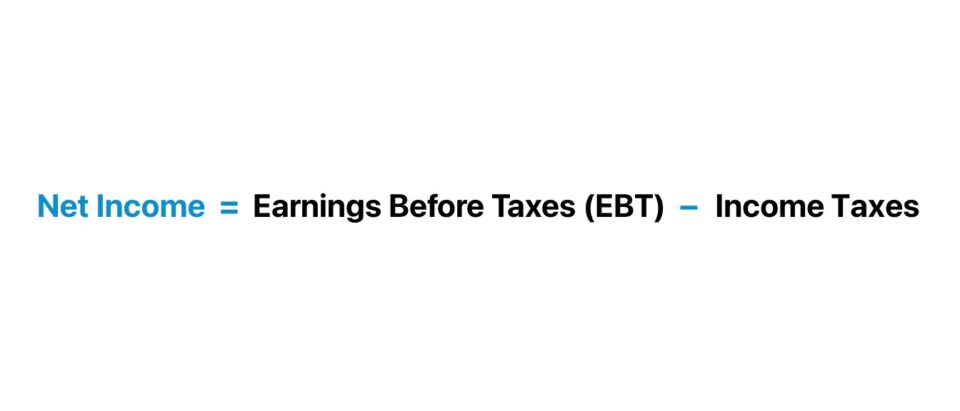
- The formula to calculate net income subtracts the income tax expense from pre-tax income (EBT).
- The net income (“the bottom line”) can be conceptualized as the remaining accounting profit once operating costs, such as COGS and SG&A, and non-operating costs, like interest and taxes, are deducted from revenue.
- While net income provides a measure of profitability according to accrual accounting standards, the profit metric might not accurately reflect a company's liquidity or solvency, which is attributable to the inclusion of non-cash items and management's discretionary accounting decisions.
What is the Definition of Net Income?
The net income metric, or the “bottom line” on the income statement, is a company’s residual earnings, inclusive of all operating and non-operating expenses incurred in a given period.
In accordance with accrual accounting reporting standards, the net income metric is the revenue left over once all operating and non-operating costs have been accounted for.
The operating costs refer to cost of goods sold (COGS) and operating expenses (SG&A).
- Cost of Goods Sold (COGS) ➝ The direct costs incurred that pertain to a company’s core operating activities that generate revenue.
- Operating Expenses (OpEx) ➝ The indirect costs incurred that are necessary, yet not part of a company’s revenue model (e.g. SG&A expense, R&D expense)
On the other hand, non-operating costs include expenses that are not part of the core operations of a company.
- Non-Operating Costs ➝ The expenses unrelated to the company’s core operations – net of any non-operating income (e.g. marketable securities, short-term investments).
- Income Taxes ➝ The local, state, and federal taxes owed and paid to the government.
Since the income statement is prepared in accordance with accrual accounting reporting standards, net income is considered a measure of the “accounting profitability” of a company.
The step-by-step process to calculate net income, written out sequentially, is as follows:
- Step 1 ➝ Calculate Gross Profit (Revenue – COGS)
- Step 2 ➝ Calculate Operating Income (Gross Profit – Operating Expenses)
- Step 3 ➝ Calculate Pre-Tax Income (Operating Income – Non-Operating Expenses)
- Step 4 ➝ Calculate Net Income (Pre-Tax Income – Income Taxes)
How to Calculate Net Income
Starting from net revenue—the “top line” of the income statement—the first step is to deduct cost of goods sold (COGS) to calculate the gross profit metric.
From the gross profit line item, the next step is to subtract operating expenses, resulting in the company’s operating income, or earnings before interest and taxes (EBIT).
Operating income (EBIT) represents the point on the income statement where all operating costs have been deducted.
Therefore, the costs recognized on the income statement thereafter are classified as non-operating items.
- Operating Costs ➝ Cost of Goods Sold (COGS) and Operating Expenses (SG&A, R&D, S&M)
- Non-Operating Costs ➝ Interest Expense, Restructuring Charges, Write-Offs or Write-Downs
The most common examples of non-operating costs are interest expense, net, and any one-time expenses, such as restructuring charges, write-offs, or write-downs.
Once non-operating costs have been subtracted from EBIT, the remaining profit is the company’s pre-tax income, or earnings before taxes (EBT).
In short, the pre-tax income (EBT) is the taxable income of the company, for bookkeeping purposes.
The interest expense is expressed on a “net” basis, because a company could have earned interest income on its marketable securities, short-term investments, or savings accounts.
Hence, the gross interest expense must be subtracted by interest income to determine the net interest expense (i.e. more interest income should reduce the interest burden).
- Interest Expense, net = Gross Interest Expense – Interest Income
The income taxes owed to the government are based on the corporate tax rate and jurisdiction of the company, among other factors (e.g. net operating losses or “NOLs”).
Once the company’s pre-tax income (EBT) has been reduced by its income tax expense, we’ve arrived at the company’s net income (the “bottom line”) for the given period.
Net Income Formula
The formula to calculate net income subtracts the income tax from pre-tax income, or earnings before taxes (EBT).
For forecasting purposes when building a financial model, the net profit line item should not be explicitly projected.
But rather, the net profit line item is a function of the operating assumptions, such as the following:
- Revenue Year-over-Year (YoY) Growth = (Ending Net Revenue ÷ Beginning Net Revenue) – 1
- Gross Profit Margin (%) = Gross Profit ÷ Net Revenue
- Operating Margin (%) = Operating Profit ÷ Net Revenue
- EBT Margin (%) = Pre-Tax Income (EBT) ÷ Net Revenue
- Effective Tax Rate (%) = Income Taxes ÷ Pre-Tax Income (EBT)
How to Find Net Income on Income Statement
For a real-life example, the income statement of Apple, Inc. (AAPL) starts off with revenue (the “top line”), which is deducted by cost of sales, operating expenses, and non-operating expenses, resulting in net income (the “bottom line”).
The separate section right below the “Net Income” line item is where the earnings per share (EPS) is reported for each period, expressed on a basic and diluted basis.
The earnings per share (EPS) of a company is calculated by dividing net income by the weighted average of total number of shares outstanding.
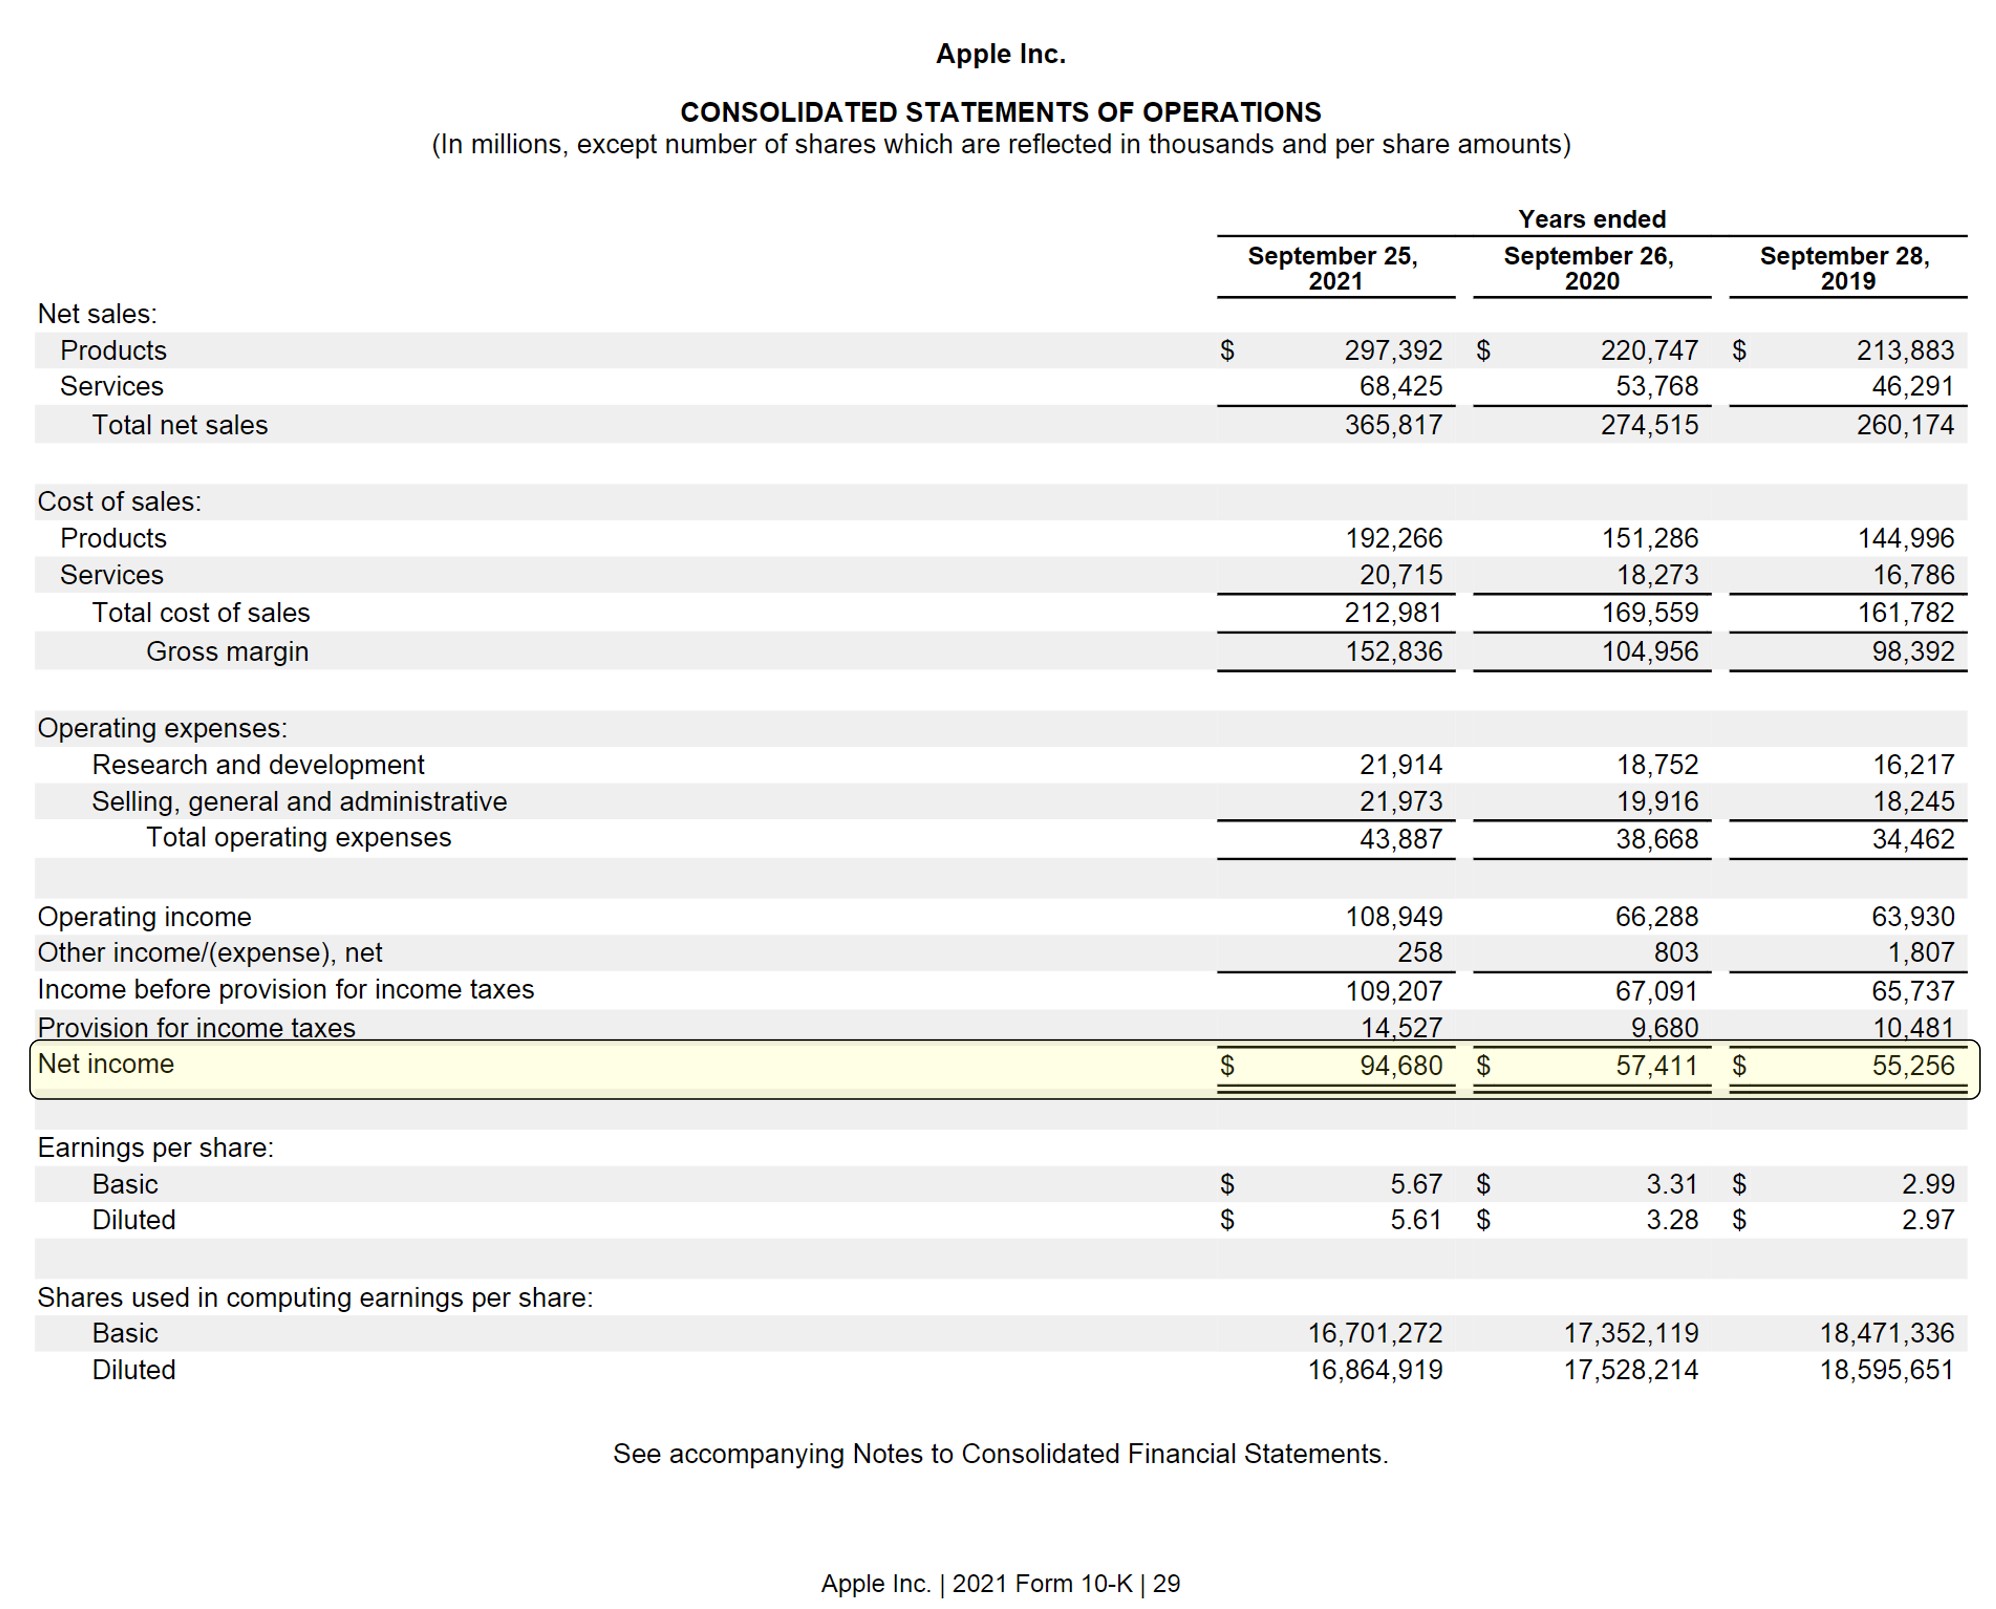
Apple Income Statement (Source: Apple 2021 10-K)
What is a Good Net Income?
By itself, net income as a standalone metric is not too meaningful. For a company’s after-tax earnings to become practical and facilitate comparisons across historical periods, including relative to its industry peers, the profit metric must be standardized.
A company’s net profits in a given period can be divided by the amount of revenue generated to calculate the net profit margin, a frequently used profitability metric among equity shareholders.
A net profit margin in excess of 10% is perceived as “good” in most cases.
But to reiterate, the industry in which the company operates sets the “benchmark” to determine if a company is more profitable (or less profitable) relative to its peers.
Learn More → Net Margin by Sector (Source: Damodaran)
Net Income vs. Cash Flow: What is the Difference?
The net income of a company can be a misleadingly measure of profitability and portrayal of its current financial state from a liquidity and solvency standpoint.
The reason? While accrual accounting has become the standardized guidelines for financial reporting, the accounting system remains flawed.
For instance, a company could consistently produce positive net earnings, but struggle to collect cash payments for sales made on credit – i.e. accounts receivable (A/R).
The sales are recognized as revenue on the income statement per accrual accounting, despite not actually having retrieved the payment from customers yet.
The discretionary corporate decisions by management can influence a company’s net profits too.
Some of the more impactful discretionary management decisions are the following examples:
- Useful Life Assumptions for Fixed Assets (PP&E)
- Depreciation Method (Straight Line vs. Accelerated Depreciation)
- Inventory Recognition Policies (FIFO vs. LIFO Accounting)
- Stock Buybacks (or Share Repurchases)
- Capital Structure (Mixture of Debt and Equity Financing)
Net Income vs. EBIT vs. EBITDA: What is the Difference?
The differences between the net income, operating income (EBIT), and EBITDA are outlined here:
- Levered Metric (Post-Interest) ➝ The fact that the cost of debt is factored into the net income line item through interest expense causes the metric to be less practical for peer comparisons, i.e. levered measure of profitability (post-interest).
- Unlevered Metric (Capital Structure Neutral) ➝ Compared to other non-levered metrics like operating income (EBIT) and EBITDA, net profit is used far less often in relative valuation, i.e. unlevered measure of profitability (pre-interest).
- Shortcomings of Accrual Accounting ➝ Most of the limitations of net income stem from the imperfections of accrual accounting, causing the metric to be prone to the risk of earnings management (i.e. manipulation of figures) and a potentially misleading portrayal of a company’s real financial state.
- Cash Flow Statement (CFS) ➝ The cash flow statement (CFS) reconciles a company’s net income – i.e. the starting line item on the financial statement – to adjust for the actual cash inflows / (outflows) to determine the true cash impact from operations, investing, and financing activities.
How is Net Income Connected to the Balance Sheet?
The connection between net income on the income statement and balance sheet is retained earnings.
Simply put, the retained earnings measures the accumulated accounting profits of a company since inception.
The formula used to calculate retained earnings on the balance sheet is equal to the prior period retained earnings balance plus net income, subtracted by any issuances of dividends to shareholders.
The “Retained Earnings” line item is recorded in the shareholders’ equity section of the balance sheet and captures the accumulated earnings kept by a company to date, net of any common and preferred dividends issued to shareholders.
Net Income Calculator — Excel Template
We’ll now move on to a modeling exercise, which you can access by filling out the form below.
1. Income Statement Historical Data
Suppose we’re tasked with calculating the net income of Apple (Nasdaq: AAPL) for the fiscal year ending 2021.
Using the figures from our earlier section, we’ll list the inputs below with the proper formatting, where the hard-coded numbers are entered in blue font, and calculations are left in black font.
| Apple (AAPL) — Income Statement | 2021A |
|---|---|
| ($ in millions) | |
| Net Sales | $365,817 |
| Less: COGS | (212,981) |
| Gross Profit | $152,836 |
| Less: R&D | (21,914) |
| Less: SG&A | (21,973) |
| Operating Income (EBIT) | $108,949 |
| Plus: Other Income / (Expense) | 258 |
| Pre-Tax Income (EBT) | $109,207 |
| Less: Income Taxes | (14,527) |
| Net Income | $94,680 |
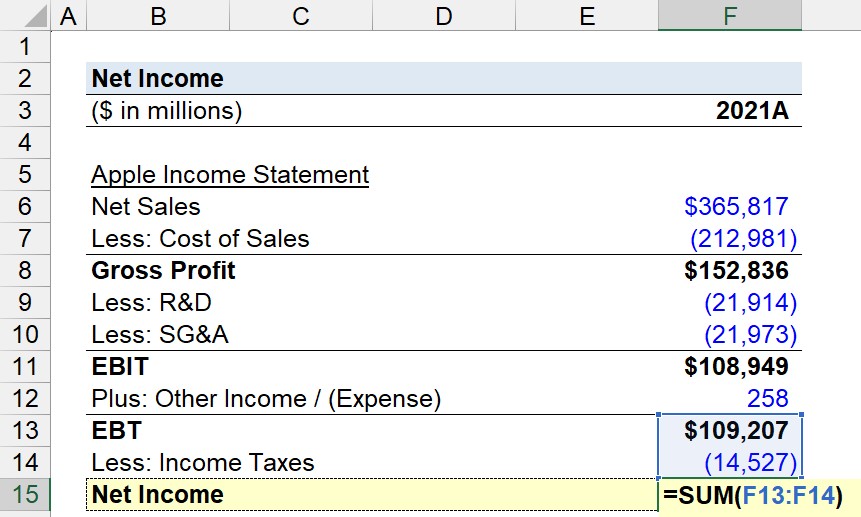
In Excel, we’ll compute each profit metric using the historical data points of Apple in fiscal year 2021.
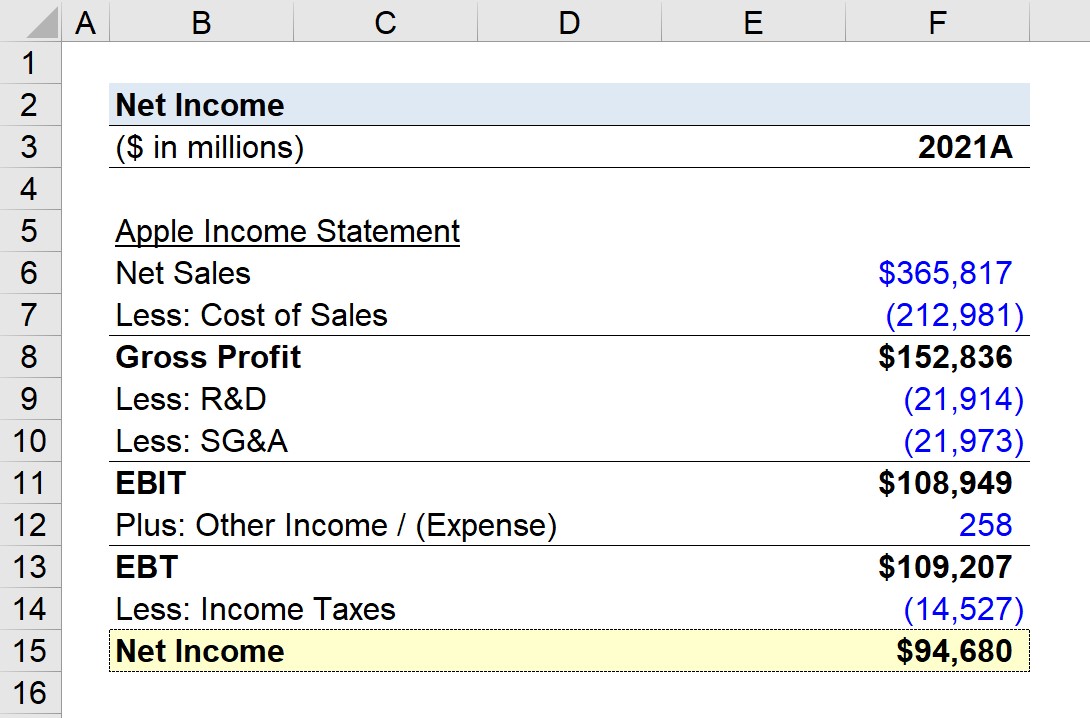
As a general financial modeling “best practice,” we recommend confirming each calculation is correct by cross-checking between the bolded figures in the table (i.e. the black font in the financial model) and the actual income statement filing of Apple (AAPL).
- Blue Font ➝ Hardcoded Input
- Black Font ➝ Calculation (or Cell Reference)
2. Net Income Calculation Example
The net income reported on Apple’s income statement was $94,680 million, confirming our calculation is, in fact, correct.
- Net Income = $109,207 million – $14,527 million = $94,680 million
3. Net Profit Margin Calculation Example
Since the net income value by itself does not offer much insight into Apple’s profitability, we’ll calculate the net profit margin by dividing net income by revenue.
- Net Profit Margin (%) = $94,680 million ÷ $365,817 million = 0.259, or 25.9%
The 25.9% net profit margin of Apple (AAPL)—which is the company’s standardized net income—can now be compared to its historical periods or to its comparable peers to analyze its current profitability.

Everything You Need To Master Financial Modeling
Enroll in The Premium Package: Learn Financial Statement Modeling, DCF, M&A, LBO and Comps. The same training program used at top investment banks.
Enroll Today


