
What is Net Debt?
Net Debt is a liquidity measure that determines how much debt a company has on its balance sheet relative to its cash on hand.
Conceptually, net debt is the amount of debt remaining once a company hypothetically paid down as much debt as possible using its highly-liquid assets, namely cash.
- The net debt metric measures liquidity risk by deducting a company's cash and cash equivalents from its gross debt balance.
- The net debt represents the remaining debt if a company were to hypothetically use its entire cash balance to pay down debt.
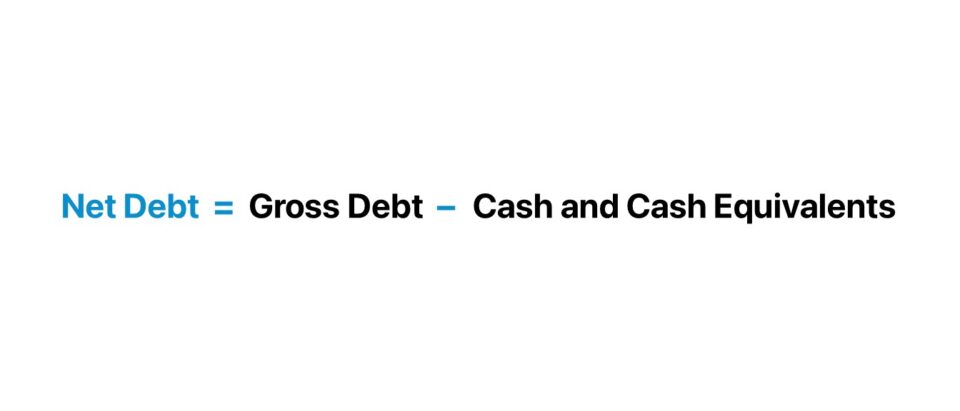
- The net debt formula subtracts gross debt by cash and cash equivalents.
- A negative net debt balance implies the company’s cash balance exceeds its debt balance.
- The net debt is added to equity value to calculate enterprise value (or subtracted from enterprise value to arrive at equity value).
- The net debt to EBITDA ratio is a common leverage metric that divides net debt by EBITDA.
How to Calculate Net Debt
The net debt of a company represents the remaining debt balance once the company’s cash is used to help pay down as much debt as possible.
Frequently used to determine the liquidity of a company, the metric shows the remaining debt balance if all of a company’s cash and cash equivalents were hypothetically used to pay down its outstanding debt obligations.
The underlying idea behind net debt is that the cash sitting on a company’s balance sheet could hypothetically be used to pay down outstanding debt if necessary.
Since the assumption is that cash helps offset the debt burden, the value of a company’s cash and cash equivalents are deducted from the gross debt.
Calculating a company’s net debt balance consists of three steps:
- Step 1 ➝ Calculate the Sum of All Debt and Interest-Bearing Obligations
- Step 2 ➝ Calculate the Sum of Cash and Cash Equivalents (e.g. Marketable Securities)
- Step 3 ➝ Subtract Gross Debt by Cash and Cash Equivalents
Net Debt Formula
The formula for calculating net debt subtracts gross debt by cash and cash equivalents.
Where:
- Gross Debt ➝ Comprises all short-term and long-term debt obligations, such as short-term and long-term loans and bonds, as well as financial claims such as preferred stock and non-controlling interests.
- Cash and Cash Equivalents ➝ Contains all cash and highly liquid investments — which refer to short-term holdings such as marketable securities, money market funds, and commercial paper.
What is a Good Net Debt?
If the net debt of a company is negative, that implies the company has a significant amount of cash and cash equivalents on its balance sheet.
The negative net debt balance is likely an indication the company is not financed with an excessive amount of debt (i.e. capital structure is composed predominately of equity, rather than debt).
In contrast, the negative balance could also simply indicate that the company is holding onto more cash in comparison to debt.
For instance, Microsoft (MSFT) and Apple (AAPL) are two real-life examples of publicly-traded companies with significant cash sitting on their balance sheet.
Given a negative net balance, the enterprise value of these companies will be lower than their equity value. Recall that the enterprise value represents the value of a company’s operations – which excludes any non-operating assets.
Therefore, companies that have accumulated large cash reserves will have a higher equity value than enterprise value.
Net Debt Calculator — Excel Template
We’ll now move to a modeling exercise, which you can access by filling out the form below.
1. Operating Assumptions
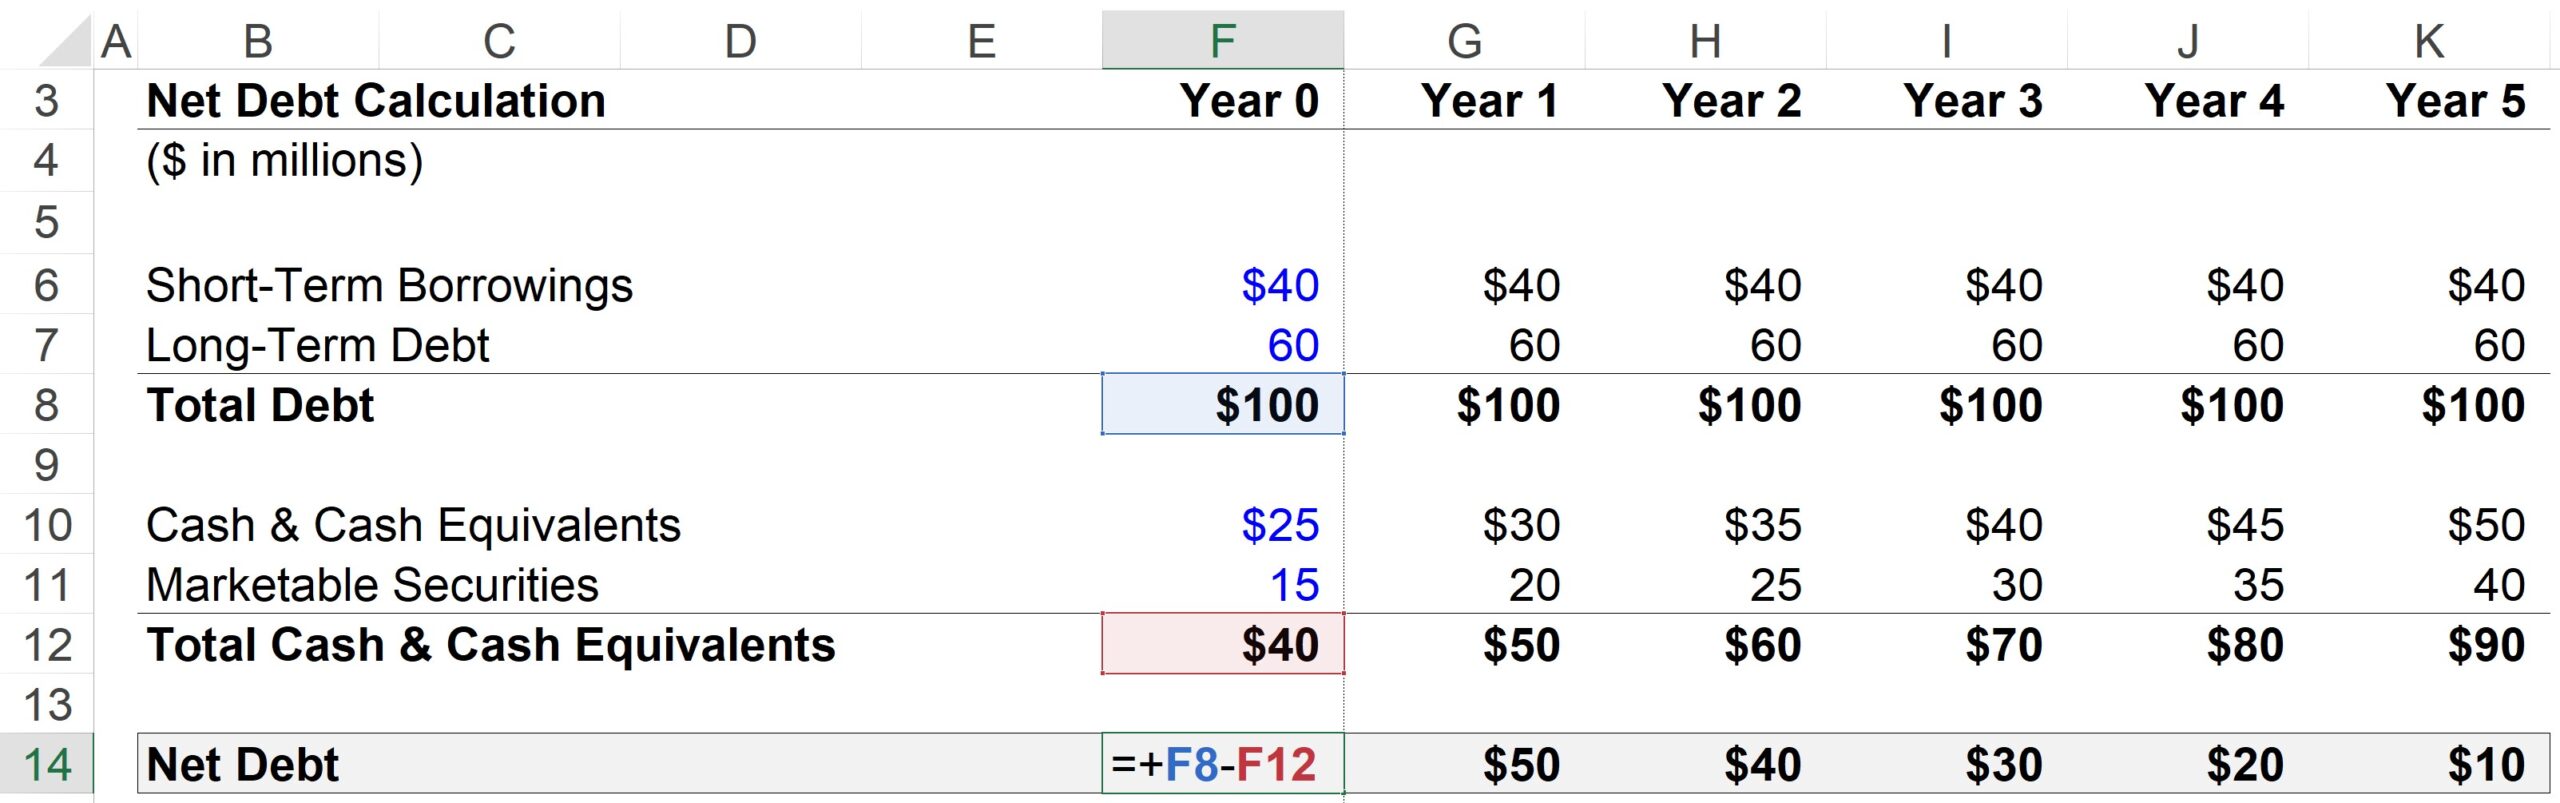
Suppose we’re tasked with calculating the net debt of a hypothetical company given the following financials in Year 0.
Year 0 Financials
- Short-Term Borrowings = $40m
- Long-Term Debt = $60m
- Cash & Cash Equivalents = $25m
- Marketable Securities = $15m
For each period in the forecast, all debt and debt-equivalents are assumed to remain constant. Cash and marketable securities, on the other hand, are going to grow by $5m per year.
- Step Function, Debt = Constant (“Straight-Line”)
- Step Function, Cash = +$5 per year
Given the growth in cash and cash equivalents, while the debt amount remains constant, it would be reasonable to expect the company’s net debt to decrease each year.
2. Net Debt Calculation Example
For Year 1, the steps to compute net debt are as follows:
- Total Debt = $40m Short-Term Borrowings + $60m Long-Term Debt = $100m
- Less: Cash & Cash Equivalents = $30m Cash + $20m Marketable Securities
- Net Debt = $100m in Total Debt – $50m Cash & Cash Equivalents = $50m
Therefore, the net debt balance in Year 1 is $50 million.
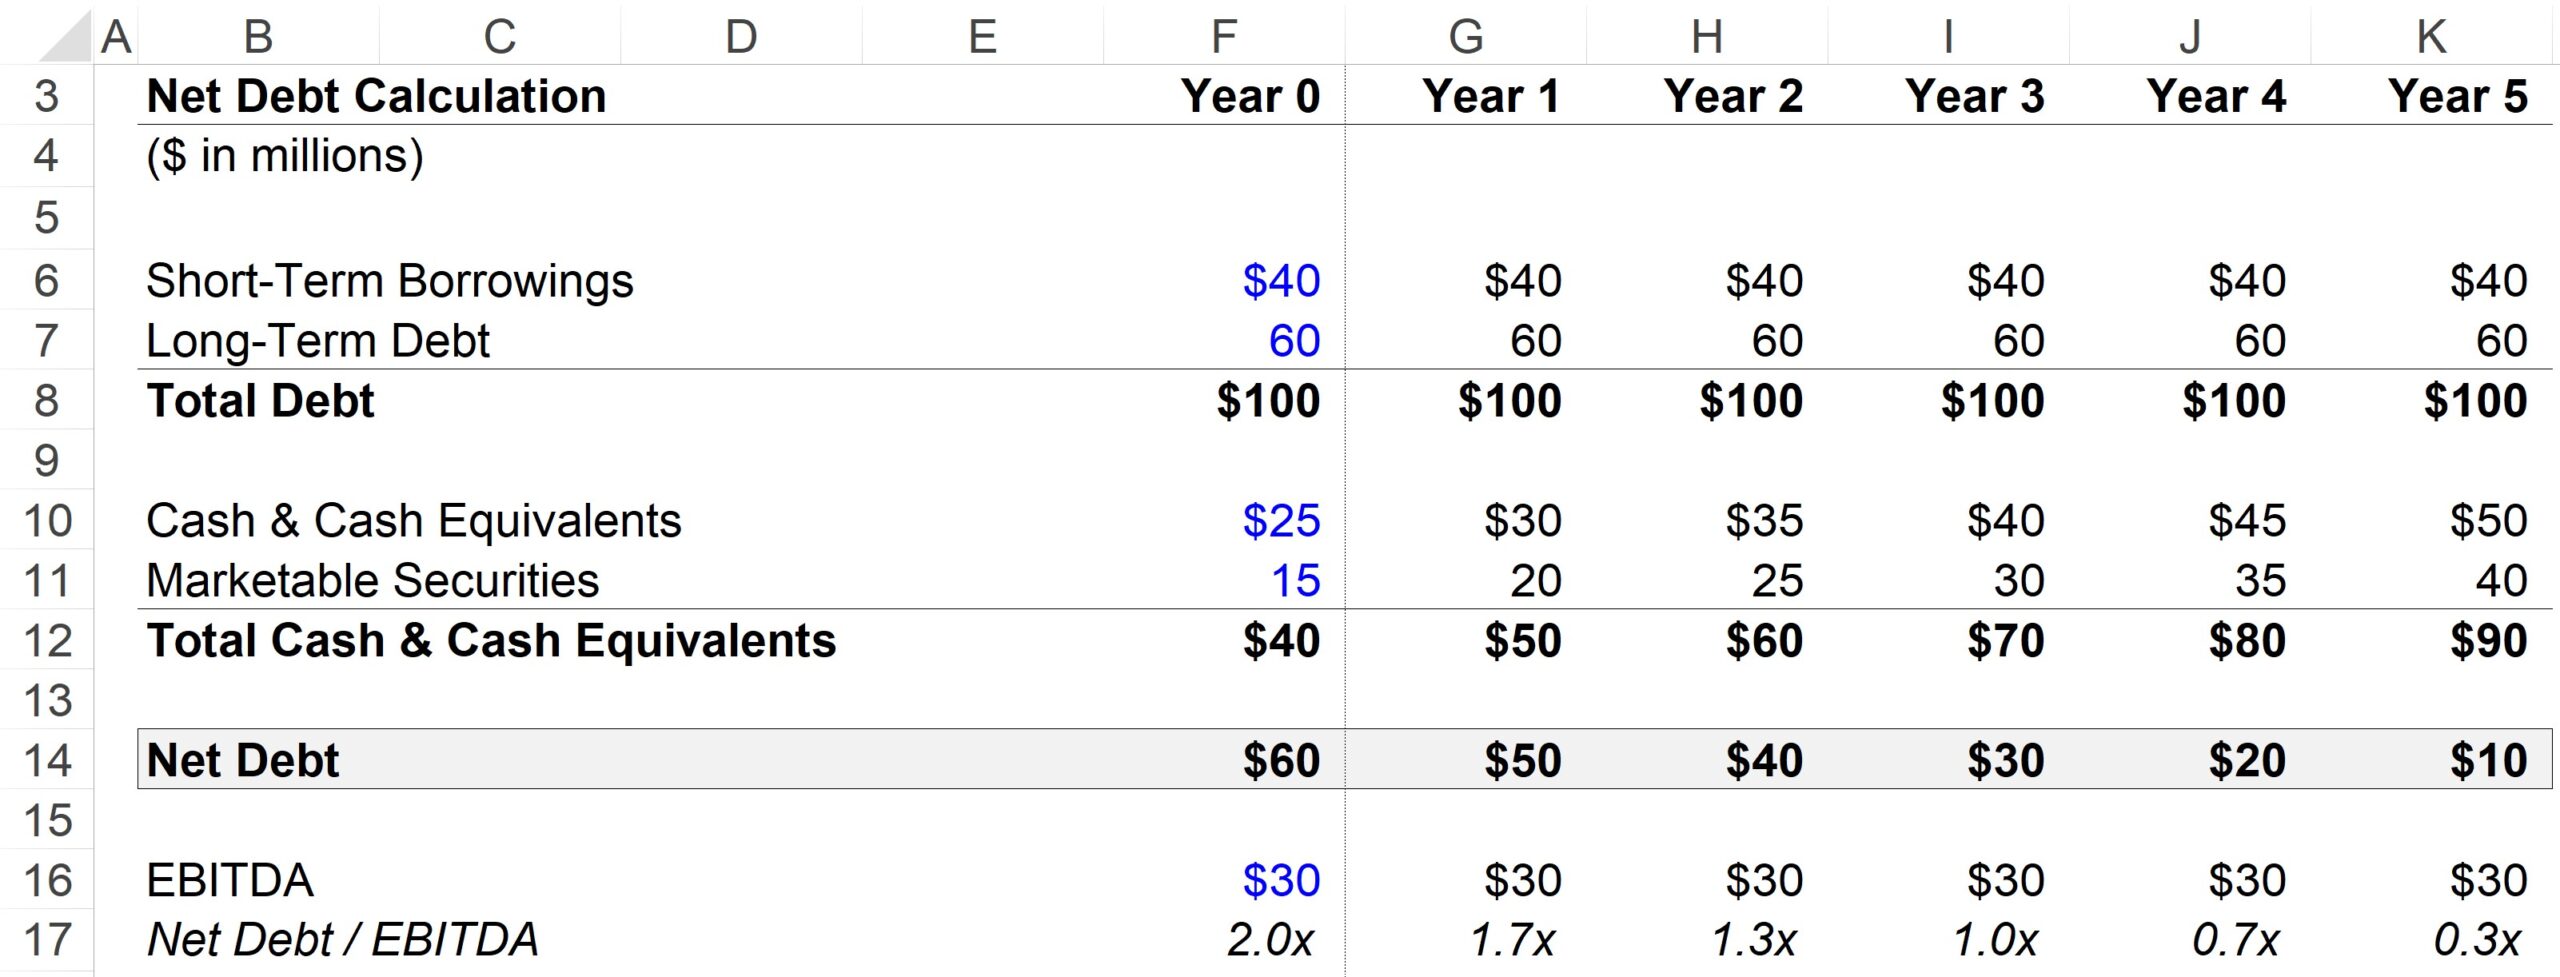
3. Net Debt to EBITDA Ratio Calculation Example
A common leverage ratio is the net debt-to-EBITDA ratio, which divides a company’s total debt minus cash balance by a cash-flow metric, which is EBITDA in this case.
For our EBITDA assumption, we’ll be using $30m for each period in the forecast.
Since cash can be used to pay down debt, many leverage ratios use net rather than gross debt, as one could argue that net (not gross) debt is a more accurate representation of the company’s actual leverage.
From the completed output below, we can see how the net debt-to-EBITDA ratio declines from 2.0x in Year 0 to 0.3x by the end of Year 5, which is driven by the accumulation of highly liquid, cash-like assets.
But in the same time span, our total debt / EBITDA ratio remains constant at 3.3x as it does not take into account the growth in cash and cash equivalents.

Everything You Need To Master Financial Modeling
Enroll in The Premium Package: Learn Financial Statement Modeling, DCF, M&A, LBO and Comps. The same training program used at top investment banks.
Enroll Today")

")


If EBITDA is a negative value how we can calculate Net Debt to EBITDA Ratio?
Would you include non current marketable securities in net debt calculations?