
- Real Estate Multifamily Acquisition Model Introduction
- How to Build an BoE Multifamily Acquisition Model?
- Acquisition Real Estate Financial Model – Excel Template
- Real Estate Acquisition Model Case Study Instructions
- Real Estate Financial Model Inputs & Drivers Section
- Real Estate Financial Model Sections
- Transaction Summary Section
- Solving the Real Estate Case Study: Answer Key
- Advanced Real Estate Financial Modeling (REFM)
Real Estate Multifamily Acquisition Model Introduction
In this article, we will walk you through a back-of-the-envelope (“BoE”) Multifamily Acquisition Model that introduces some of the core real estate financial modeling concepts and those tested during the real estate private equity recruiting process.

How to Build an BoE Multifamily Acquisition Model?
BoE multifamily acquisition models are a common method for REPE professionals to quickly model a potential real estate investment without all the dynamic bells and whistles of a full-blown model.
The BoE Multifamily Acquisition Model contains the basic elements required to determine a range of possible IRR returns to a REPE investor, given a high-level set of assumptions about the asset’s operating forecasts, leverage and exit price.
While REPE modeling tests can vary in complexity, they will generally be more complex than a BoE model, such as monthly cash flows (vs. annual in the BoE model), dynamic timing formulas, detailed debt schedule, and an equity waterfall.
A BoE model saves time and energy, and can be a good initial test for whether an investment is worth investing more time in.
Acquisition Real Estate Financial Model – Excel Template
You’ll see an empty template and a completed template with the answers. To follow along, I recommend you work in the empty worksheet and try to recreate what you see in the walk-through, and check your work against the answer sheet at the end.
Real Estate Acquisition Model Case Study Instructions
Below is a simple multifamily acquisition scenario and a walk-through of the BoE model you might build on a first pass or some modeling tests.
With the introductions behind us, let’s dive into building a multifamily acquisition model.
Multifamily Acquisition Model Case Instructions
(Download Case Instructions PDF)
A real estate private equity firm is evaluating the acquisition of Creekstone Apartments (“Creekstone”), a multifamily property with 100 units. Build a BoE model to answer the following:
- Based on the following transaction assumptions, what are the levered IRR and multiple?
- If the minimum IRR threshold is 15.0%, what is the highest possible exit cap rate?
- What is the minimum rent premium necessary to achieve the 15.0% IRR threshold?
Historical Financials
Over the trailing twelve months (“T-12”), Creekstone achieved $1.45M in net effective rent, averaged 88% occupancy, and lost $30K of revenue to bad debt and non-revenue units. In addition, Creekstone generated $100K in total other revenue. Creekstone’s T-12 operating expenses are below:
Repairs & Maintenance $55,000 General & Administrative $37,000 Payroll $100,000 Utilities $30,000 Real Estate Taxes $255,000 Total OpEx $477,000
Transaction Assumptions
- The REPE firm acquires Creekstone for a purchase price of $15,000,000 on 12/31/2020
- The REPE firm will own the property for 5 years, and then exit at a 6.25% cap rate on 12/31/2025
Operating Performance Drivers
- Occupancy – YR1: 90%, YR2: 91%, YR3: 92%, and 93% thereafter
- Rent Growth – YR1: 0%, YR2: 2%, and 3% thereafter
- Bad Debt & Non-Revenue Units – T-12 constant percentage of Net Effective Rent
- Other Revenue Growth – YR1: 0% and 3% thereafter
- Expense Growth – YR1: 0% and 2% thereafter
Capital Expenditure Assumptions
- The REPE firm intends to implement a unit renovation business plan:
- Cost Per Unit – $5K
- Timing – YR1: 50% and YR2: 50%
- Rent Premium – the renovations are expected to provide $100 in additional monthly rent per unit immediately and fully at the start of the year they are renovated (this is a simplifying assumption)
- Defensive Capex – $100K in Year 1
Financing Assumptions
- Loan Amount – $9.75M
- Interest Rate – LIBOR + 300
- Amortization – 5%
- Origination Fee – 1%
- LIBOR – YR1: 1.5%, YR2: 1.7%, YR3: 1.9%, YR4: 2.1%, YR5: 2.3%
- Assume the loan is fully paid off at the time the property is sold
Based on the assumptions provided above, calculate the IRR and Multiple on a levered and unlevered basis.
Real Estate Financial Model Inputs & Drivers Section
Model Assumptions
The first section of the multifamily acquisition model (and real estate models in general) will be the assumptions area (inputs & drivers). Notice we have included all historical inputs and key operating, financing and transaction assumptions here:
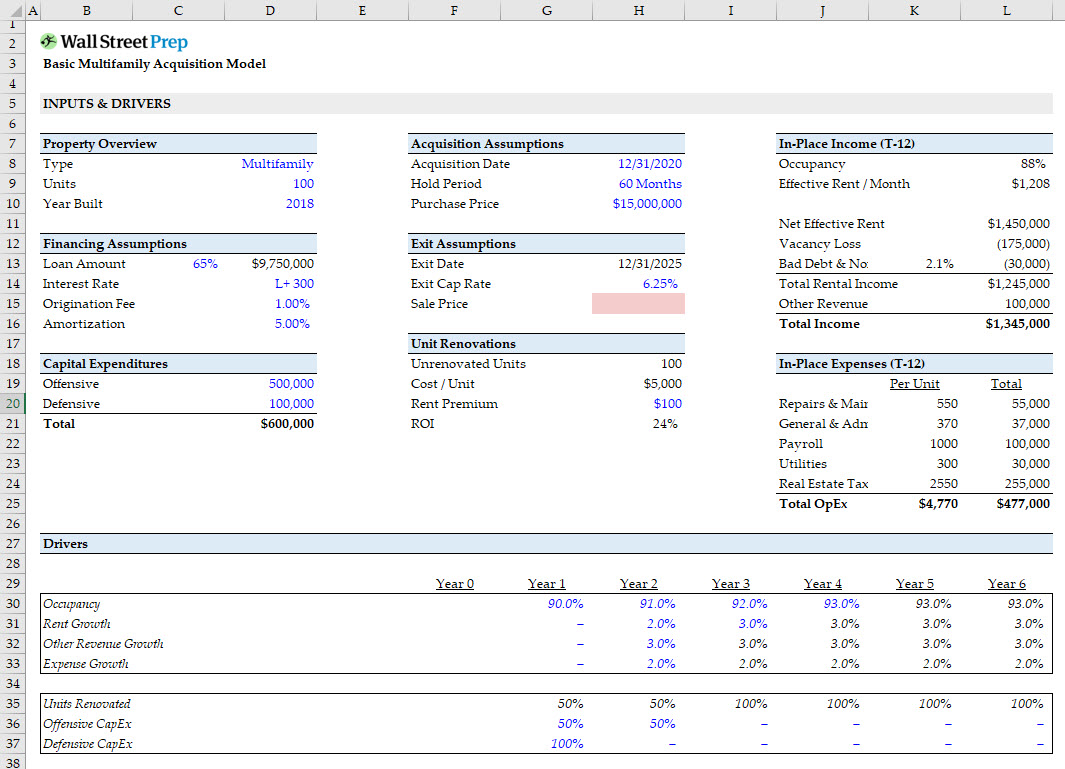
Key Points:
- Sale price: This is blank for now, as we won’t be able to calculate the sale price until we’ve forecasted Net Operating Income (NOI)
- ROI on unit renovations: Calculated as $100 in incremental monthly rent x 12 months / $5,000 per unit renovation cost
- In-place income and expenses: We assume that in-place is T-12 for this exercise, but depending on the situation, it could be T-1, T-3, or a combination
- Effective rent per month: Calculated as net effective rent / 12 months / # of units; keep in mind, this is before vacancy losses and bad debt & non-revenue units
- Occupancy rate and vacancy loss: An occupancy rate of 88% enables us to back into a vacancy loss of $175,000 as: Vacancy loss = net effective rent – (net effective rent x occupancy rate) = $175,000
Keep in mind that historical financials should be input into the model section. From those historical financials, we can then pull the desired historical information into the “in-place” areas of the model Inputs & Drivers. From those historical financials, we will also be able to calculate the current effective rent per month as well as occupancy.
What data will you need?
A number of key assumptions will drive your model. The better information you can gather around these key inputs, the more useful your model will be. A few key assumptions worth conducting some diligence on include the Purchase Price, Sale Price, and Effective Rents. This information can be found in a number of places, including:
- Broker quotes (Purchase Price)
- Sales Comparables (Purchase Price, Sale Price)
- Market Surveys (Effective Rents)
The Wharton Online and Wall Street Prep Real Estate Investing & Analysis Certificate Program
Level up your real estate investing career. Enrollment is open for the Feb. 10 - Apr. 6 Wharton Certificate Program cohort.
Enroll TodayReal Estate Financial Model Sections
Operating Proforma
With the assumptions in place, the operating proforma can be modeled:
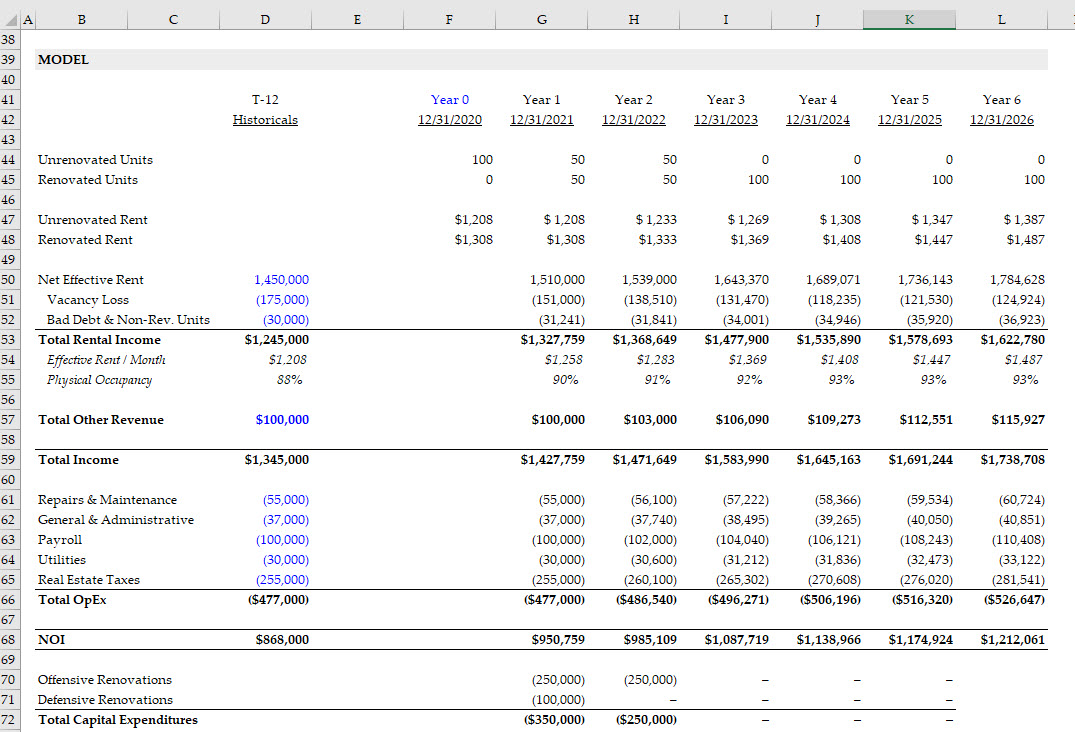
The forecasts are all driven by the T-12 Historical Financials and the assumptions inputted into the Inputs & Drivers section above. Keep in mind the following:
- Net effective rent is driven from a per unit monthly rent assumption. Here, we assume that renovations immediately provide the rent premium benefits. This is a common simplifying assumption, because multifamily properties typically have ~50% annual turnover, and landlords can move rents overnight. In more complex models, unit renovations and the associated rent premiums will be integrated into the model using more specific assumptions.
- Vacancy Loss is back-solved using the occupancy rate assumption from the inputs section and the net effective rent forecast in the model section.
- Net Operating income (NOI) is a key measure of operating profit for a multifamily property. The NOI in the exit year will be used to determine the sale price (using the 6.25% cap rate assumption). Note that NOI should not include capital expenditures.
What data will you need?
The T-12 Historical Financials are necessary to accurately build this section of the model. This information can be found in a number of places, including:
- Offering memorandums (download an example of a RE Multifamily OM (PDF))
- Investment sales brokers
- Seller of the property
- Joint venture partner
Unlevered Returns
Now that NOI has been calculated, we can calculate the sale price and unlevered returns for this investment. Although REPE investors typically use debt to finance transactions – and, as we’ll see in a subsequent step, can be a significant driver of investment returns – it is helpful to also look at unlevered returns to evaluate investments on a level playing field irrespective of financing decisions:
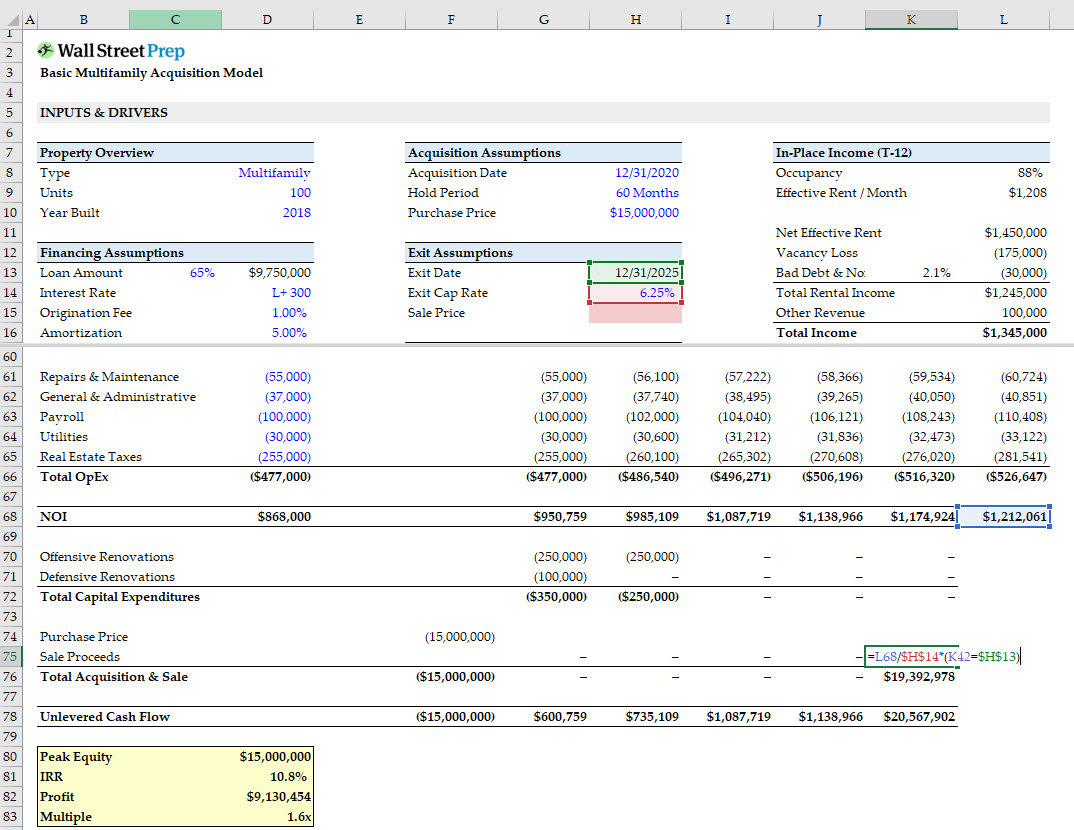
Here we can observe the following:
- Sale Proceeds: Calculated as the forward year NOI divided by the cap rate assumption. It should be easy to see that accuracy in forecasting the NOI is only half the story. Determining the exit cap rate for a property 5 years in advance is one of the most crucial assumptions in the analysis, and this is usually a function of how comparable properties are currently valued.
- Unlevered cash flow: The sale proceeds are not the only cash flows – you must also add NOI and deduct capital expenditures over the hold period.
The yellow box summarizes the unlevered returns profile:
- Profit: Represents simply how much cash the investor generated over the holding period, less the initial investment
- Multiple: Represents how much cash the investor generated as a multiple of the initial investment
- IRR: Factors in the hold period, such that the longer the holding period, all else equal, the lower the IRR (time value of money)
- Peak equity: Represents the amount of equity capital required to be invested in the transaction
Levered Returns
In the next section, we forecast debt payments to arrive at levered returns – which is actually what the returns will be, since a REPE deal is usually funded with some debt.
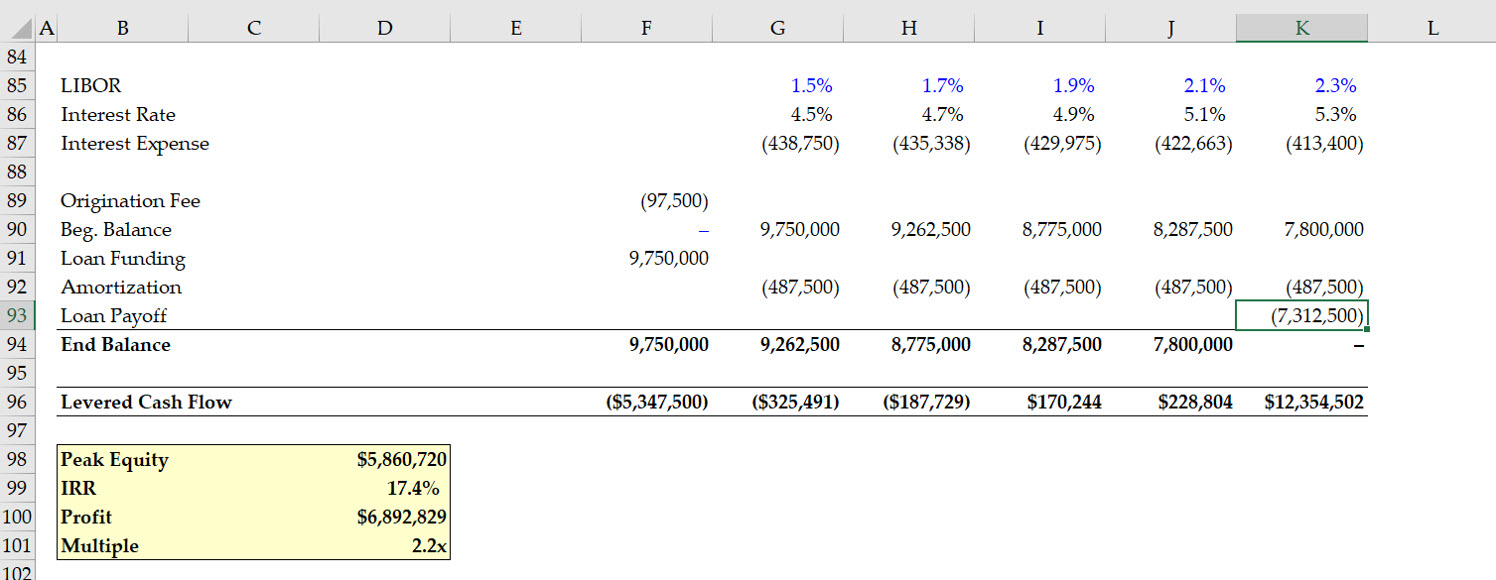
In this example, we’ve provided a very simple capital structure with a straightforward senior loan of $9.75M, which amounts to a loan-to-value (LTV) ratio of 65% – a common leverage point for a multifamily real estate transaction.
What data will you need?
Because real estate is a highly levered asset class, financing terms can have a significant impact on levered returns. For this reason, it’s important to do some research on what current market financing terms are. This information can be found in a number of places, including:
- Offering memorandums
- Lender term sheets
- Lender term sheets from similar deals
- Verbal quotes from potential lenders
Interest expense: Floating rate loans are usually priced off LIBOR + a spread, so the LIBOR forecast (which usually comes from a LIBOR curve) is the moving variable in the forecast to arrive at interest expense. Note that interest expense is calculated off the beginning of the period debt balance in the model. In more complex models with cash sweeps, the approach of calculating interest expense from the beginning of period debt balances avoids a circular reference. We have written about how to handle model circularities due to cash sweeps in a separate post about the LBO modeling test.
Origination fee: The origination fee is paid upfront.
Principal amortization: Per the inputs section, 5% of the original debt balance must be paid back to the lender each year.
Loan funding and payoff: In the first year, the cash inflow from the loan is reflected, while in the exit year, the remaining principal balance on the loan is repaid.
Levered cash flows: These are the cash flows that flow to the REPE investor, and the model calculates it as:
Levered cash flow: unlevered cash flow – interest expense – amortization – origination fee (year 1 only) + loan funding (year 1 only) – loan payoff (exit year)
As with unlevered cash flows, the yellow box summarizes the returns profile, only this time it’s the actual returns to the REPE investor because it captures the impact of leverage:
- Profit, multiple, and IRR: Notice how profits are lower, while the multiple and IRR are higher than the unlevered returns. This should make sense – while the debt means lower profits in absolute dollars, the real estate private equity firm can write a much smaller equity check, such that returns are amplified. Assuming the model’s assumptions hold, the investor would generate a 17.4% levered return on this investment.
- Peak equity: Notice how the investor has to put up equity in year 0 (the acquisition date), but also expects additional equity infusions in years 1 and 2, due to capital expenditures. The peak equity represents the total amount of equity that must be put into the investment – not just the initial check – and is factored into the total sources of funds in the sources & uses of funds schedule (see below). In this way, REPE models can differ slightly from regular LBO models, which predominantly rely on a revolving credit line and excess cash to fund cash shortfalls. The mechanics can differ deal by deal – some loans will include funding for capital expenditures, some will require the investor to set aside cash in Year 0 to cover capital expenditures. An investor may decide to spread the capital expenditures over time so that excess cash flows cover them.
Transaction Summary Section
We are now ready to complete the model. We start with Sources and Uses (S&U) – this ubiquitous table in LBO and M&A models is a simple way to clearly see how much capital needs to be raised to make a deal happen, and how that capital will be funded. Keep in mind: the Transaction Summary section should reference the Model section whenever possible. Said another way, avoid referencing the Inputs & Drivers section, so that any errors in linking your inputs and model are not covered up.
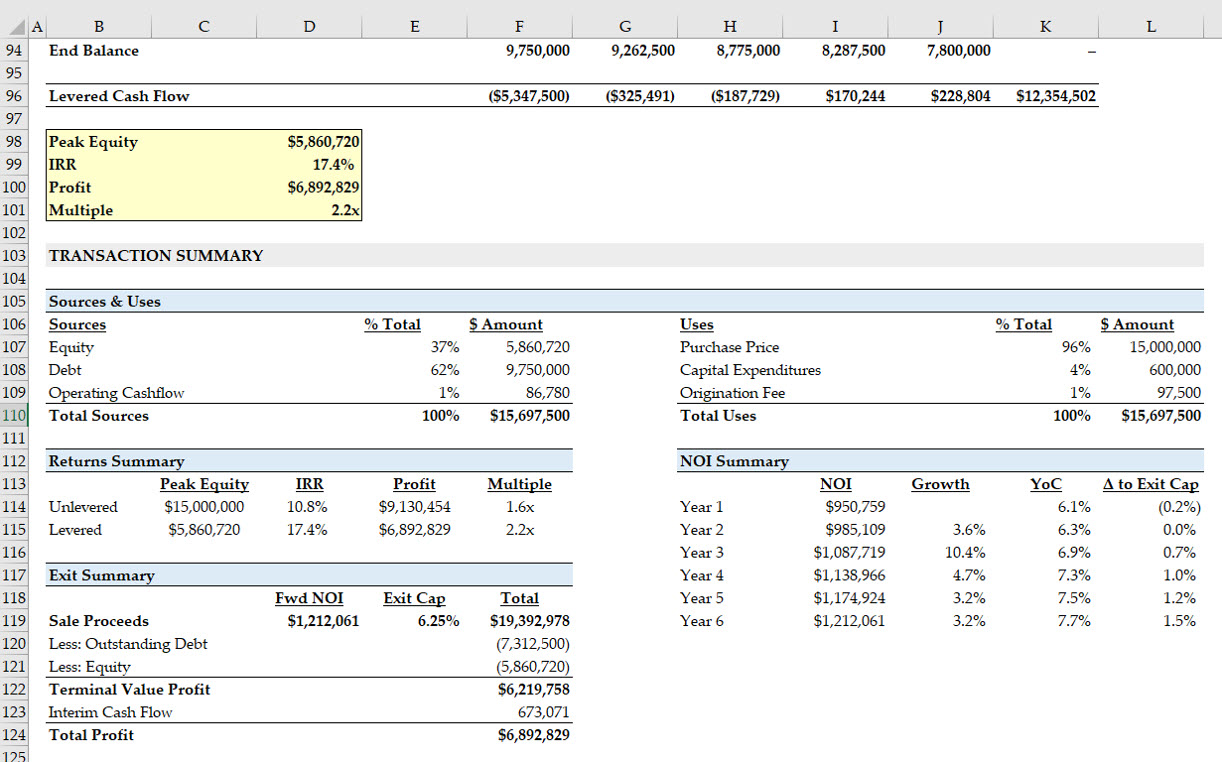
Sources & Uses Table
Uses
It’s easier to start with Uses – enough funds need to be raised to:
- Buy the Real Estate Asset (i.e. the Property Purchase Price)
- Pay the Origination Fee
- Pay for Capital Expenditures (Capex)
Sources
To complete the Sources section, we start with the basic premise that once you’ve defined the amount of uses for capital, you then need to find sources for exactly that amount of capital. In simple English: sources must equal uses. The model thus references total uses into the total sources cell. The individual components making up ‘Sources’ are:
- Debt: This is usually the biggest source of funds and can be found by summing the Loan Funding line in the Model section.
- Equity: Since the investors not only have to invest upfront in year 0, but must also write additional checks to fill shortfalls in years 1 and 2, the total peak equity can be found by summing all the negative leveraged cash flows.
- Operating cash flows: This is the plug in the S&U table and represents how much of the planned capital expenditures are not going to be funded by additional equity checks but rather through the asset’s internal cash profits.
Solving the Real Estate Case Study: Answer Key
To wrap up this real estate financial modeling tutorial, we will answer the three questions posed at the beginning of the article.
- Based on the following transaction assumptions, the levered IRR would be 17.4%, and the multiple would be 2.2x.
- If the minimum IRR threshold is 15.0%, the highest exit cap rate the REPE firm could exit at is approximately 6.75%.
- To achieve a 15.0% IRR, the REPE firm would have to achieve minimum rent premiums of $50.
Advanced Real Estate Financial Modeling (REFM)
In this walk-through, we introduced the core mechanisms of a multifamily acquisition model, such as incorporating historical financials, forecasting occupancy and rent growth, building to NOI, a simplistic debt schedule, returns calculations, and sources & uses.
While this might be enough to pass a simple REPE modeling test, there are more advanced concepts likely to be tested, including:
- Monthly Cash Flows
- Dynamic Timing Formulas
- Detailed Debt Schedule
- Equity Waterfall
For more comprehensive training, we have developed a step-by-step program that contains the same instructional material trusted by leading real estate private equity firms to train their analysts and associates.
The Wall Street Prep Real Estate Financial Modeling Package includes more than 20 hours of detailed instructional material, including two interview-quality case studies:
")

")


I am struggling to understand amortization here. Can anyone kindly clarify?