
What is Marginal Cost?
The Marginal Cost quantifies the incremental cost incurred from the production of each additional unit of a good or service.
How to Calculate Marginal Cost
The marginal cost is fundamental to companies being able to price goods and services appropriately and turning a profit.
The costs of operating a company can be categorized as either fixed or variable costs.
- Fixed Costs → The costs that remain constant regardless of production volume and sales performance (e.g. rent, utilities).
- Variable Costs → The costs that fluctuate based on the company’s production output and sales figures (e.g. raw materials, direct labor).
If changes in the production volume result in total costs changing, the difference is mostly attributable to variable costs.
The marginal cost of production captures the additional cost of producing one more unit of a good/service.
The analysis of the marginal cost helps determine the “optimal” production quantity, where the cost of producing an additional unit is at its lowest point.
The marginal cost of production must be lower than the price per unit for a company to be profitable – thus, the marginal cost pinpoints the output volume and pricing where incremental costs are reduced.
Economies of Scale Graph: How to Find Marginal Cost Curve (MC)
Marginal costs provide insights into the optimal production output and pricing, i.e. the point where economies of scale are achieved.
Beyond the optimal production level, companies run the risk of diseconomies of scale, which is where the cost efficiencies from increased volume fade (and become negative).
If marginal costs are plotted on a graph, the curve would be “U-shaped,” as costs gradually shift downward once production volume increases.
But eventually, the curve reverses trajectory and climbs upwards due to the law of diminishing marginal returns.
Understanding the relationship between changes in quantity and changes in costs results in informed decisions when setting production targets.
Companies operating near their optimal production level improve the odds of a net positive impact on cash flows and profit margins.
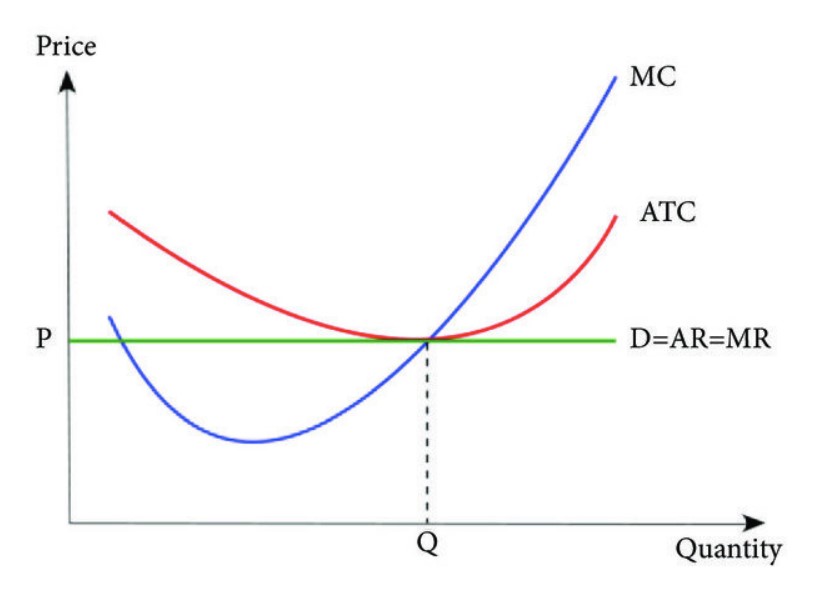
Three Cost Curves (Source: Journal of Applied Mathematics)
Marginal Cost Formula
The marginal cost formula requires three inputs:
- Total Costs of Production
- Change in Costs
- Change in Quantity
The first step is to calculate the total cost of production by calculating the sum of the total fixed costs and the total variable costs.
Next, the change in total costs and change in quantity (i.e. production volume) must be tracked across a specified period.
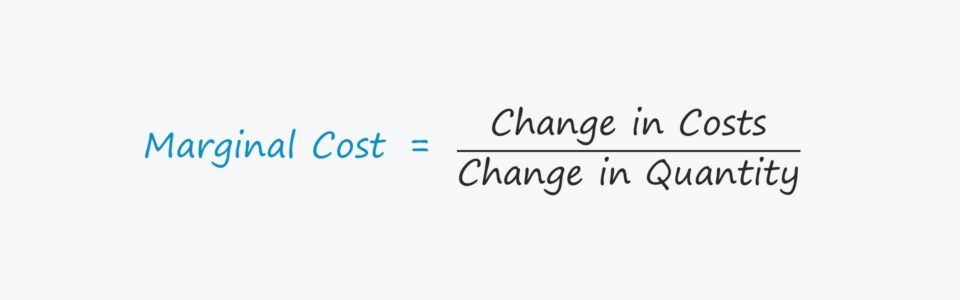
The final step is to calculate the marginal cost by dividing the change in total costs by the change in quantity.
The Wharton Online & Wall Street Prep Applied Value Investing Certificate Program
Learn how institutional investors identify high-potential undervalued stocks. Enrollment is open for the Feb. 10 - Apr. 6 cohort.
Enroll TodayMarginal Cost vs. Marginal Revenue: What is the Difference?
The marginal cost (MC) is the incremental cost incurred from increasing the quantity by a unit, whereas the marginal revenue (MR) represents the incremental revenue obtained by increasing the quantity by one unit.
In economics, the profit metric equals revenues subtracted by costs. Therefore, a company’s profits are maximized at the point at which its marginal costs are equivalent to its marginal revenues, i.e. the marginal profit is zero.
Marginal Cost Calculator
We’ll now move to a modeling exercise, which you can access by filling out the form below.
Marginal Cost Calculation Example
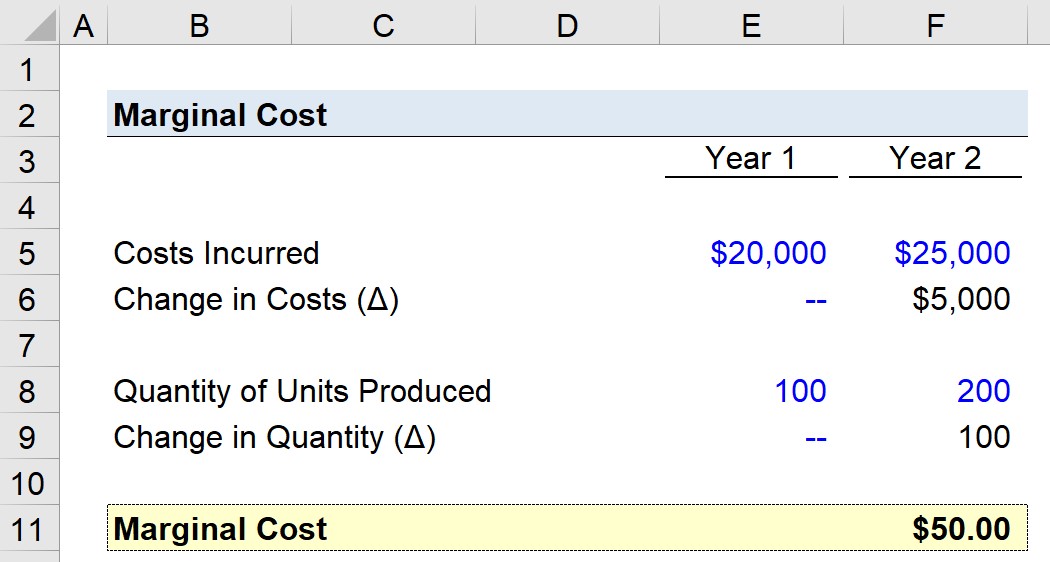
Suppose a company produced 100 units and incurred total costs of $20k.
- Year 1 Costs = $20k
- Year 1 Quantity = 100 Units
In the following year, the company produces 200 units at a total cost of $25k.
- Year 2 Costs = $25k
- Year 2 Quantity = 200 Units
The year over year (YoY) differential, i.e. the delta, is the following:
- Change in Costs = $5,000
- Change in Quantity = 100 Units
The total change in cost is $5k, while the total change in production is 100 units.
- Marginal Cost = ($25k – $20k) / (200 – 100) = $50.00
In our illustrative example, the marginal cost of production comes out to $50 per unit.


Please i am a form 4 student can i subscribe to the program?