- What is LTV/CAC?
- How to Calculate LTV/CAC Ratio
- LTV/CAC Ratio Formula
- What is Good LTV:CAC Ratio in the SaaS Industry?
- How to Improve LTV to CAC Ratio
- What Factors Cause Low LTV-CAC Ratio (<1.0x)?
- How to Perform Cohort Analysis Using LTV to CAC Ratio
- LTV/CAC Ratio Calculator — Excel Template
- 1. Lifetime Value (LTV) Calculation Example
- 2. ARPA Calculation Example
- 3. Margin Multiple Calculation Example (LTV Discount Rate)
- 4. Customer Acquisition Cost (CAC) Calculation Example
- 5. LTV/CAC Ratio Calculation Example
- 6. Alternative LTV to CAC Calculation Example
What is LTV/CAC?
The LTV/CAC Ratio measures the relationship between the lifetime value of a customer and the cost incurred to acquire that customer.
The customer lifetime value (LTV) refers to the profit attributable to a particular customer, while the customer acquisition cost (CAC) is the expense incurred in convincing the customer to purchase the product (i.e., convert into a paying customer).
- LTV/CAC ratio is a SaaS KPI that compares Lifetime Value (LTV) and Customer Acquisition Cost (CAC).
- Lifetime value (LTV) is the estimated profit generated by an average customer, while the customer acquisition cost (CAC) represents the expense incurred to acquire that customer.
- LTV/CAC ratio matters most for early-stage SaaS companies, as the KPI provides insights into the cost efficiency of their sales and marketing (S&M) spending, which can determine the sustainability of their business models.
- The standard benchmark for the ideal LTV/CAC ratio is around 3.0x in the SaaS industry.
- If the LTV to CAC ratio is below 1.0x, that implies there are challenges in monetizing new customers, while a ratio above 5.0x indicates the company might need to pivot and prioritize growth.
- A low LTV/CAC ratio could be attributed to ineffective budgeting, an unclear target market, or a broad strategy that is not profitable.
- LTV is influenced by the retention rate, gross margin, and ARPA (Average Revenue Per Account), while CAC is influenced by factors like marketing efficiency and sales efficiency.
How to Calculate LTV/CAC Ratio
The LTV/CAC ratio stands for “Lifetime Value to Customer Acquisition Cost” and is perhaps the important metric for evaluating software-as-a-service (SaaS) companies.
In practice, the LTV/CAC ratio is most often used to gauge a SaaS company’s cost efficiency in terms of its sales and marketing (S&M) spending, which ultimately determines its long-term feasibility of its current business model.
Simply put, the LTV to CAC ratio answers, “Are the current customer acquisition strategies of the SaaS business sustainable?”
Traditional GAAP reporting standards fall short in depicting the financial performance of these software companies accurately. Hence, the SaaS industry collectively relies on its own set of metrics to help bridge the disconnect between GAAP and non-GAAP metrics.
While the LTV:CAC ratio is most frequently used to analyze early-stage SaaS companies, the scope of its usage extends to any type of business with repeat purchases, such as e-commerce and direct-to-consumer (DTC) companies.
To optimize the LTV:CAC ratio, a SaaS company must maximize lifetime value (LTV) and minimize customer acquisition costs (CAC), while ensuring the impact on the retention rate is marginal (i.e. customer churn does not offset the benefits).
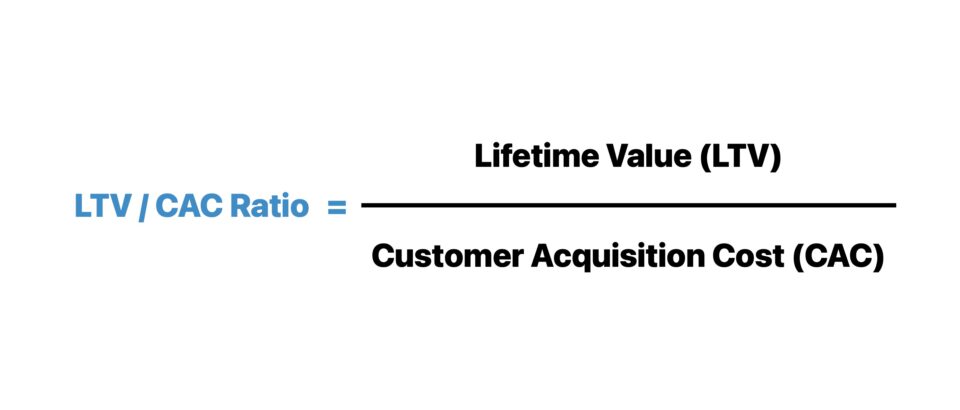
The LTV/CAC ratio is computed by dividing the total sales (or gross margin) attributable to a customer over their entire lifetime (LTV) by the total cost incurred to initially convince that same customer or customer group to make their first purchase (CAC).
- Step 1 ➝ Estimate Customer Lifetime Value (LTV)
- Step 2 ➝ Calculate Customer Acquisition Cost (CAC)
- Step 3 ➝ Divide Customer Lifetime Value (LTV) by Customer Acquisition Cost (CAC)
LTV/CAC Ratio Formula
The formula to calculate the LTV/CAC ratio divides the customer lifetime value (LTV) by the customer acquisition cost (CAC).
Where:
- Customer Lifetime Value (CLV) = (ARPA × Gross Margin) ÷ Churn Rate
- Customer Acquisition Cost (CAC) = Σ Sales and Marketing (S&M) Expenses ÷ Number of New Customers Acquired
Conceptually, the LTV to CAC ratio measures the return on investment (ROI) of each dollar that the company spent in order to acquire that customer initially.
By comparing the lifetime value (LTV) and customer acquisition cost (CAC) to one together, the LTV:CAC ratio effectively shows whether the expenses incurred to acquire customers are worth the economic value received in return from said customers.
For the business model of a SaaS company and customer acquisition strategy to be repeatable and feasible over the long run, the profits derived from customers must be in excess of the costs associated with acquiring them.
If not, the SaaS company’s business model is not sustainable over the long haul, and would only be a matter of time before
What is Good LTV:CAC Ratio in the SaaS Industry?
For early-stage SaaS companies, the general guidelines for a “good” LTV/CAC ratio are as follows.
| LTV:CAC Ratio | Interpretation |
|---|---|
| LTV/CAC ➝ ~3.0x |
|
| LTV/CAC ➝ <1.0x |
|
| LTV/CAC ➝ >5.0x |
|
How to Improve LTV to CAC Ratio
Often, it is normal for CACs to start out on the lower end as the target market and customer acquisition strategy were intentionally left open-ended.
The start-up should ideally be able to make the proper adjustments post-feedback and insights collected from customer data as it matures and enters the growth-stage.
A sign of progress in the right direction is reflected in the LTV/CAC ratio converging towards 3.0x – which represents a more normalized, sustainable rate.
Otherwise, the unsustainable cash burn rate will eventually catch up to the company as it soon runs out of the funds raised (and investors become reluctant to offer more capital).
While there are well-funded companies that can burn through their cash reserves at rather rapid paces, certain companies can continue raising capital—often from growth equity funds—because of the following factors:
- Product-Market Fit (PMF) ➝ The product concept and the business model has been relatively validated via market traction.
- Upside Potential ➝ The LTV/CAC ratio might be lower than the target range; nevertheless, the market and revenue opportunity seems compelling enough for existing or new investors (i.e. lack of funding is holding back growth).
- Competition ➝ The reason behind the spending pace might be due to the increased competition and funding of similar start-ups, which again validates the product concept (e.g., Uber Eats vs. Grubhub / Seamless vs. DoorDash)
Or, if a start-up does not seem to be spending sufficiently, this could suggest that either growth opportunities in the industry are scarce or management is being overly conservative with spending, which places the start-up at the risk of trailing behind its competitors in the market.
What Factors Cause Low LTV-CAC Ratio (<1.0x)?
An LTV/CAC ratio of 1.0x means the company is right at the break-even point – but note, CAC excludes expenses unrelated to acquiring customers. That said, an LTV/CAC below 1.0x means the company is failing to break even.
Starting out, if the LTV/CAC ratio is too low, there are adjustments that must be implemented before attempting to scale. Upon closer examination, the start-up could be making the mistakes of:
- Ineffective Budgeting ➝ For example, a sizable portion of the budget may be spent in less effective S&M channels, whilst the under-funded campaigns are bringing in most of the new customers
- Unclear Target Market ➝ Targeting markets composed of inadequate product demand leads to poor traction and revenue growth, as expenses continue to accumulate
- Broad Strategy ➝ Being too broad in the sales strategy and market segmentation often coincides with the inefficient allocation of capital (i.e., low return on investment)
In other cases, the LTV/CAC ratio might start out near 3.0x but decline as the market matures. The downtrend suggests the competitive landscape has become saturated with new entrants, making the acquisition of new customers more difficult (and costlier).
And then in the worst-case scenario, an LTC/CAC ratio consistently on the lower end despite constant modifications points towards the potential of there being a more concerning underlying issue (e.g., the lack of product-market fit, an unmonetizable end-market).
The Wharton Online and Wall Street Prep Private Equity Certificate Program
Level up your career with the world's most recognized private equity investing program. Enrollment is open for the Feb. 10 - Apr. 6 cohort.
Enroll TodayHow to Perform Cohort Analysis Using LTV to CAC Ratio
The majority of companies examine LTV/CAC at a more granular level using a customer cohort analysis, which rather than looking at just a single “average customer,” breaks down customers into multiple different customer groups according to various parameters such as demographics or even the initial year of acquisition.
After performing cohort analysis using the LTV:CAC ratio, a couple examples of insightful questions that can be answered include the following:
- Q. “Based on historical profitability and product demand, which customer profile should the company target?”
- Q. “Is the current state of the business model feasible in terms of becoming profitable someday in the future while being able to scale efficiently?”
- Q. “How much spending should be allocated toward hiring sales reps and marketing campaigns?”
Upon calculating the LTV/CAC for each customer profile, the most profitable customers must be determined and then be strategically marketed towards.
Companies can oftentimes benefit from narrowing their market focus and establishing a niche based on their most profitable segments (and later have the option to enter other markets).
As a side benefit, a targeted sales & marketing campaign permits more effective, personalized marketing since the specific end markets and customer types are identified.
Otherwise, the company might eventually continue burning cash at an unsustainable rate until it is ultimately forced to unwind and shut down operations.
For early-stage SaaS companies moving beyond the product development period, being able to monetize users consistently, maintaining high customer retention rates, and the efficient allocation of capital are critical components in obtaining market traction and continuing to grow.
The underlying components that contribute the LTV/CAC ratio are as follows.
- Customer Lifetime Value (LTV) ➝ 1) Retention Rate, 2) Gross Margin and 3) ARPA
- Customer Acquisition Cost (CAC) ➝ 1) Marketing Efficiency and 2) Sales Efficiency
The reason LTV/CAC carries such importance is that each dollar spent to acquire new customers should be justified by the value derived from those customers in return.
LTV/CAC Ratio Calculator — Excel Template
We’ll now move on to a modeling exercise, which you can access by filling out the form below.
1. Lifetime Value (LTV) Calculation Example
The lifetime of the customer represents the implied duration an average customer remains with the company.
Since we are working towards estimating the value of a customer, we must take into account how long a typical customer does business with a company, as no customer stays a customer perpetually.
As we mentioned earlier, certain customers will ultimately unsubscribe (in the case of a subscription-based company) or otherwise stop purchasing at some point. We call this the customer churn rate, which is defined as the percentage of existing customers who discontinue their relationship with the company in a given year.
The formula used to calculate the customer lifetime is thus one divided by the customer churn rate.
For example, if the annual customer churn rate is 5% (which means that 5% of existing customers discontinue their relationship with the company in any given year), then the lifetime would be calculated as 1 ÷ 5%, which comes out to 20 years. We can interpret 20 years as being the average length an average customer stays a customer of the company.
The flip side of thinking about the churn rate is the retention rate. The retention rate is the average percentage of customers who continue their relationship with the company in any given year, and is calculated as 1 minus the churn rate. In our example here, the retention rate would thus equal 95%.
- Retention Rate = 1 – 5% = 95%.
Although our example used an annual churn rate, a monthly churn rate could also be used here. But regardless of which is used, the important thing is to remain consistent throughout the entirety of the calculation with either monthly or annual metrics in order to avoid timing mismatches.
2. ARPA Calculation Example
Once we know how long on average a given customer stays a customer with the company, to continue in our calculation of LTV, we need to know how much revenue on average a given customer generates per year.
To estimate the average revenue generated by a single given customer per year, we calculate the average revenue per account (“ARPA”).
The formula for ARPA is the company’s total recurring revenue divided by the current number of active users.
As previously mentioned, be mindful of being consistent regarding timing. Since we used the annual churn above, we will now use annual recurring revenue (“ARR”) as the numerator in the ARPA formula.
Once ARPA is calculated, it is multiplied by the gross margin to arrive at the gross contribution per customer.
Note that to calculate gross contribution per customer, we should only take into account the variable costs directly related to serving the customer.
And then, lifetime value (LTV) can be calculated using the formula below:
To reiterate, the LTV denotes the average gross contribution a single customer is expected to generate for the business over its lifetime.
The LTV is critical to track because it can be among the most useful data points in projecting the future revenue that can be expected from each customer.
As such, LTV can be a proxy for the “value” of the customer to the company. And by quantifying how much value the average customer provides during the entire lifespan of their relationship, the company can measure how much it can reasonably spend to acquire these customers.
3. Margin Multiple Calculation Example (LTV Discount Rate)
The inclusion of a discount rate as part of the LTV formula accounts for the time value of money and reflects how much a company values receiving payment right now versus at a later date.
The standard discount rates range around:
- Public Companies ➝ 8% to 10%
- Late-Stage Private Companies ➝ 10% to 15%
- Early-Stage Start-Ups ➝ 15% to 20%+
Discount rates are higher for an early-stage company because it values earlier payments more given its risk profile (i.e., cash burn rate, urgent spending needs, inconsistent free cash flows).
However, the discount rates used are highly subjective and will vary depending on the person performing the analysis. Certain people use a 10% discount rate for early-stage, high-risk companies under the assumption that the company would someday be public (i.e., a best-case scenario).
The margin multiple is the right side of the LTV formula shown above. Often referred to as the “multiplier”, it is calculated with the retention rate as the numerator, and the denominator consisting of one plus the discount rate minus the retention rate.
Here, the gross profit contribution by the customer is taken and multiplied by the present value of the lifetime – thus, the output could be interpreted as a “discounted” customer lifetime value.
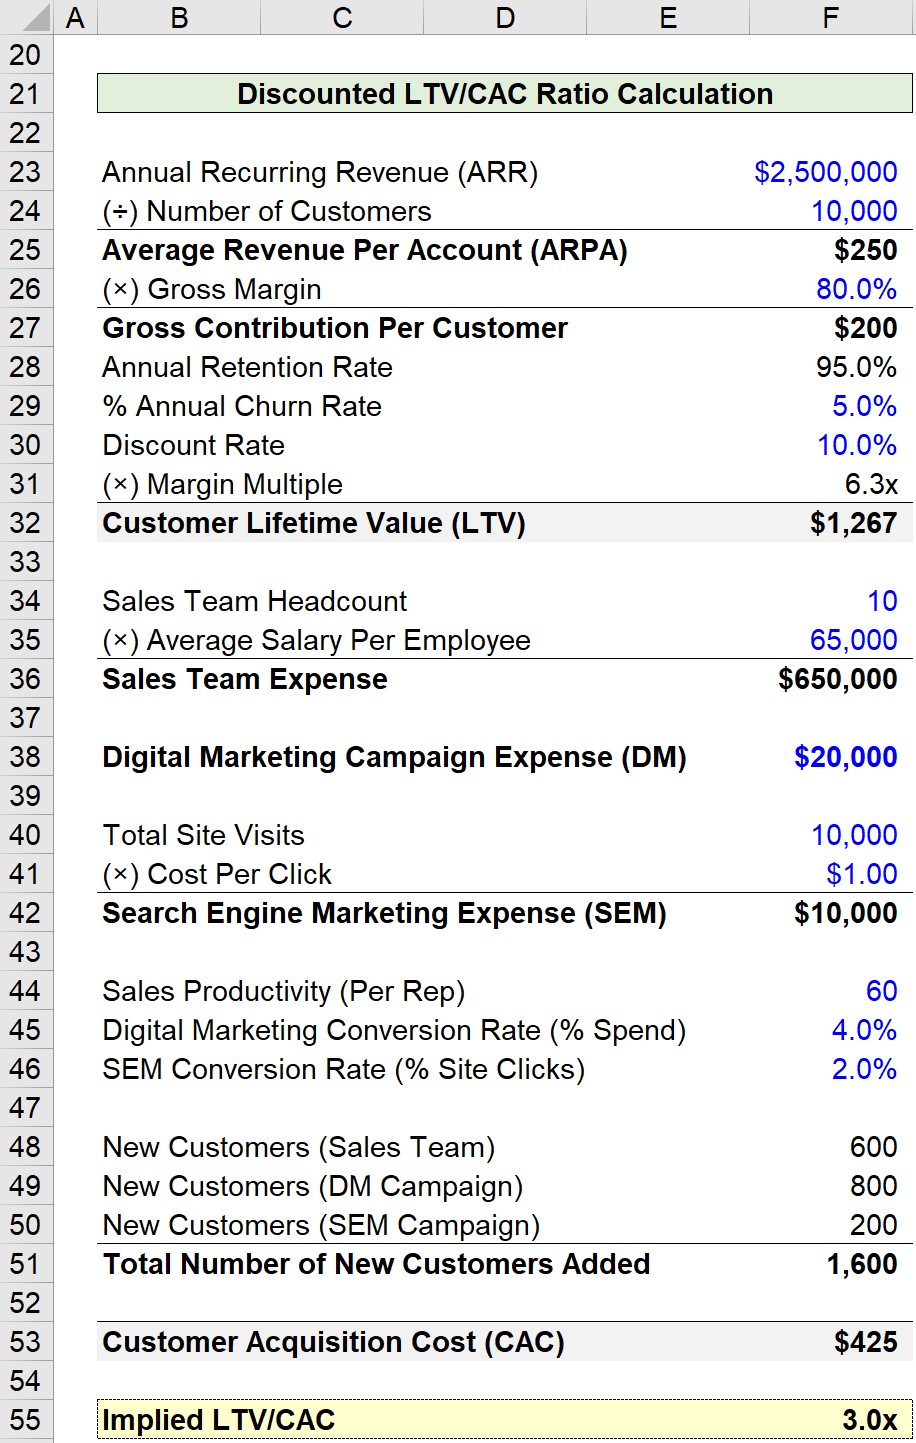
In the hypothetical scenario used in our template, the key financial data is as follows:
- ARPA ➝ The ARR is $2.5mm with 10,000 total customers, which means ARPA is $250
- Gross Contribution ➝ Upon applying the 80% gross margin to the ARPA, the gross contribution per customer comes out to $200
- Retention Rate ➝ Given the 5% annual churn rate, the retention rate can be backed out of by just subtracting the churn rate from one, which is 95%
- Margin Multiple ➝ To calculate the margin multiple, the 95% retention rate is the numerator, while the denominator is comprised of 1 plus the 10% discount rate, less the 95% retention rate
- Lifetime Value (LTV) ➝ The LTV can now be calculated by multiplying the $200 gross contribution by the margin multiple of 6.3x, which comes out to approximately $1.27k
4. Customer Acquisition Cost (CAC) Calculation Example
The customer lifetime value (LTV) is a proxy for how profitable acquired customers acquired are, which is compared to the spending required to acquire them.
Now the LTV has been calculated, we can move on to calculating the customer acquisition cost (CAC), the denominator in the LTV/CAC ratio.
CAC is the total cost incurred to make the customer initially purchase the products being sold. In short, the CAC is the sum of all sales & marketing (“S&M”) expenses divided by the total number of new users acquired.
To acquire new customers, companies use a variety of marketing tactics, sales channels (e.g., digital, social media), and in-person strategies – furthermore, the effectiveness and return on investment of those strategies can be measured via the LTV/CAC ratio.
Going back to our example, the three channels (and cash outflows) related to new customers acquisitions are:
- Sales Team Compensation ➝ Ten sales reps that are each paid $65k every year
- Digital Marketing Campaign Expenses ➝ $20k is spent on digital marketing such as targeted social media and email campaigns
- Search Engine Marketing Expenses ➝ SEM utilizes a pay-per-click (“PPC”) model, where one click costs $1.00 and there were a total of 10,000 site visits (and therefore a $10k expense)
From the prior section, we determined that our hypothetical company spent $680k to acquire 1.6k new customers this year, which comes out to a CAC of $425.
- Total Sales and Marketing Spend = $680k
- New Customer Additions = 1.6k
- Customer Acquisition Cost (CAC) = $425
5. LTV/CAC Ratio Calculation Example
So we’ve now arrived out our final step, where we have computed the two components required to calculate the LTV/CAC ratio.
The only remaining step here is to divide the two parts that we calculated up to the current point.
The completed output from our model is shown below, which shows our company’s LTV/CAC ratio comes out to 3.0x.
- LTV/CAC Ratio = $1.27k ÷ $425 = 3.0x
By dividing the LTV of $1.27k by the CAC of $425, we arrive at 3.0x for the implied LTV/CAC. Another way to think about this result is that for every $1 spent on sales and marketing, the company generated $3 of additional gross contribution.
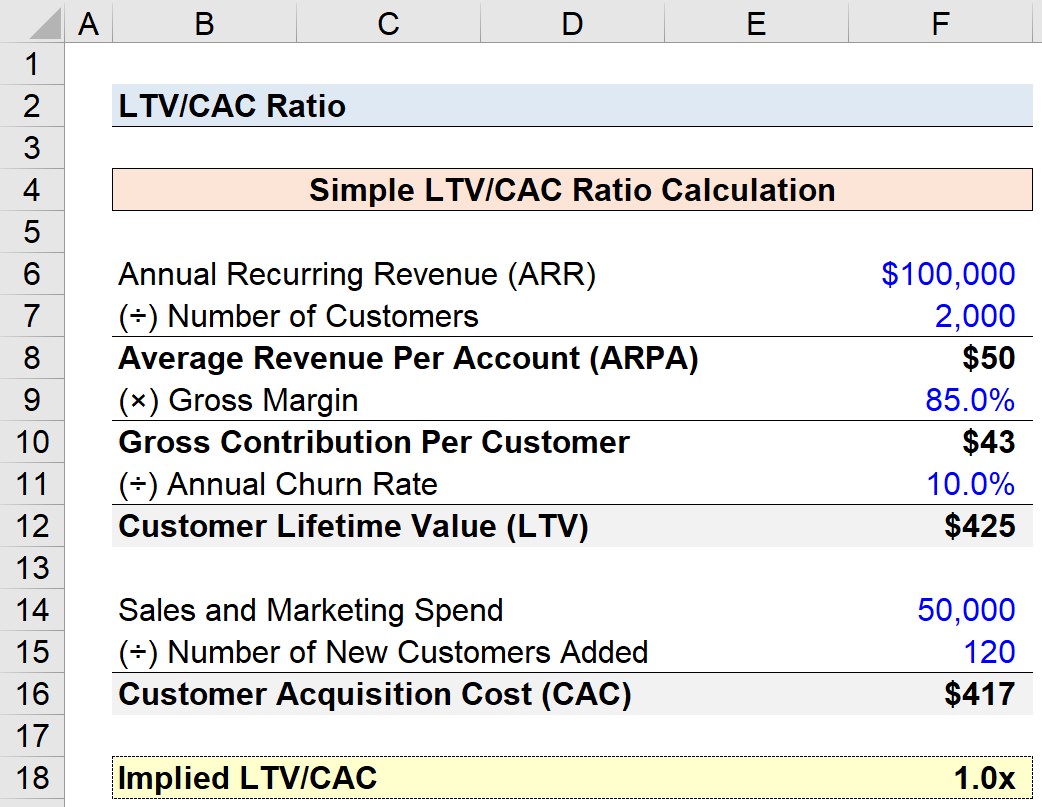
6. Alternative LTV to CAC Calculation Example
An alternative approach uses a simpler formula for calculating the lifetime value (LTV), also eliminating the concept of a discount rate:
The ARR is $100,000 with 2,000 customers (and $50 average revenue per account, or ARPA), implying our hypothetical SaaS company is at the seed-stage (sub-$1mm revenue)
By dividing the contribution margin of $43 by the annual churn rate of 10%, we get an LTV of $425.
- Lifetime Value = ($50 x 85%) ÷ 10.0% = $425
In the last step, we can divide the $425 LTV by the $417 CAC, which comes out to an implied LTV/CAC a slight bit over 1.0x
- LTV/CAC Ratio = $425 ÷ (50k ÷ 120) = 1.0x
Therefore, for each dollar spent on sales and marketing, the company generated merely $1.00 per additional gross contribution.
In closing, the SaaS company is barely managing to break-even on its sales and marketing spend (S&M), and must implement strategic adjustments to its business model to expand its lifetime value (LTV) and reduce its customer acquisition cost (CAC).