
- What is Liquidity Risk?
- What is the Definition of Liquidity Risk?
- What are Liquid Assets?
- Liquidity Risk and Premium: Stock Market Investments
- How to Analyze Balance Sheet Liquidity?
- Liquidity Risk Calculator
- 1. Balance Sheet Assumptions
- 2. Liquidity Risk Calculation Example
- 3. Liquidity Risk Ratio Analysis
What is Liquidity Risk?
Liquidity Risk measures the marketability of an asset and the ease at which is can be converted into cash, without incurring a monetary loss.
What is the Definition of Liquidity Risk?
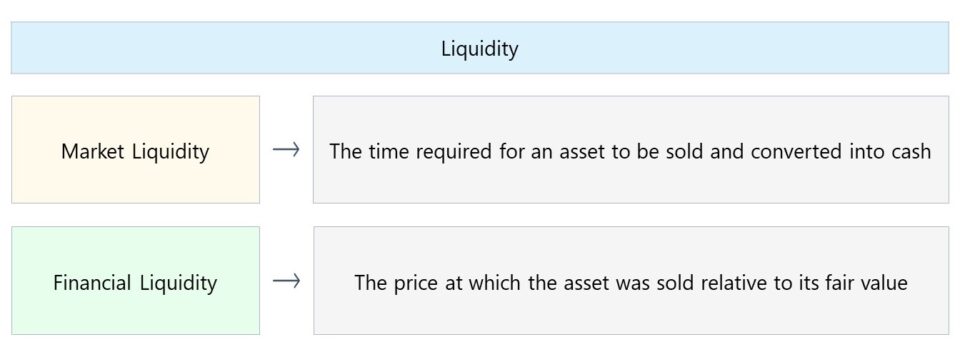
The liquidity risk concept can be measured in two forms: 1) market liquidity and 2) financial liquidity.
- Market Liquidity: Market liquidity describes the time necessary for an asset to be liquidated and sold for cash in the secondary market.
- Financial Liquidity: The other component of liquidity aside from the timing aspect – financial liquidity – focuses on the price at which the asset was sold relative to its fair value, i.e. the size of the discount required.
The quicker the asset can be converted into cash, the more liquid the asset (and vice versa).
Conceptually, the ease or difficulty the seller encounters while attempting to sell the asset is determined by supply and demand.
- Seller’s Market → The most favorable scenario, from the perspective of sellers, is if the market demand is high while the supply is low. On that note, liquid assets can be sold at (or near) their fair value, without the seller having to attach a steep discount to incentivize buyers in the market.
- Buyer’s Market → In contrast, the least favorable condition would be if demand among buyers is low, while supply is over-abundant.
Therefore, a liquid asset should expect to retrieve a higher valuation than if it were an illiquid asset – all else being equal – because of the so-called “liquidity premium” priced into the valuation.
What are Liquid Assets?
In the prior section, we defined the meaning of liquidity, so we’ll provide a list of real-life examples of liquid assets here.
The types of assets deemed the most liquid, aside from cash itself, include the following:
- Government Bonds (e.g. T-Bills, T-Bonds)
- Marketable Securities
- Certificate of Deposit (CD)
- Savings Accounts
- Money Market Funds
- Low-Risk, Short-Term Investments
Because of how quickly these assets can be sold in the market with either no or a marginal reduction in price, the assets listed above are frequently consolidated within the “Cash and Cash Equivalents” line item in the current assets section of the balance sheet.
The next list consists of other assets also considered to be liquid, however to a lesser degree than those above.
- Accounts Receivable (A/R) → Accounts receivable refers to payments not yet collected but owed to a company by its customers, who paid using credit, instead of cash, for a good or service already delivered (and thus “earned” per accrual accounting). While most customers eventually fulfill such a cash payment obligation, there are often exceptions where the company is later forced to write off the receivables as uncollectible (i.e. bad debt).
- Inventory → Inventory is another current asset with liquidity that can vary substantially based on the context. Certain inventories have broad applications and can be sold easily at a minor discount, whereas others can be difficult to liquidate even with a significant discount.
Liquidity Risk and Premium: Stock Market Investments
Corporate bonds with high credit ratings and common shares wherein the underlying issuers are financially sound can be relatively easy to sell due to the sheer volume in the bond and public equities market.
Nevertheless, unanticipated circumstances can reduce the demand in the market and the sale price, which could stem from the issuer (e.g. missed earnings guidance) or external events (e.g. economic conditions, geopolitical risk).
That said, the term “liquidity risk” refers to the potential monetary losses incurred by an investor attempting to exit a position due to insufficient buyer demand in the market.
The absence of market demand prevents the investor from selling at the time desired and the sale price might have to be reduced, especially if it is a “fire sale”, i.e. the urgent liquidation of the securities.
Hence, the securities of widely-recognized public companies with high trading volume trade at a premium relative to thinly traded securities from smaller-sized companies with lower trading volume.
How to Analyze Balance Sheet Liquidity?
The balance sheet liquidity ratios are a method to measure the capacity of a company to meet its short-term obligations (<12 months due date).
There are four liquidity ratios widely used and relied upon to determine a company’s near-term financial health.
| Liquidity Ratio | Description |
|---|---|
| Current Ratio |
|
| Quick Ratio |
|
| Cash Ratio |
|
| Net Working Capital Turnover (NWC) |
|
The formula for each liquidity ratio can be found here:
Liquidity Risk Calculator
We’ll now move on to a modeling exercise, which you can access by filling out the form below.
1. Balance Sheet Assumptions
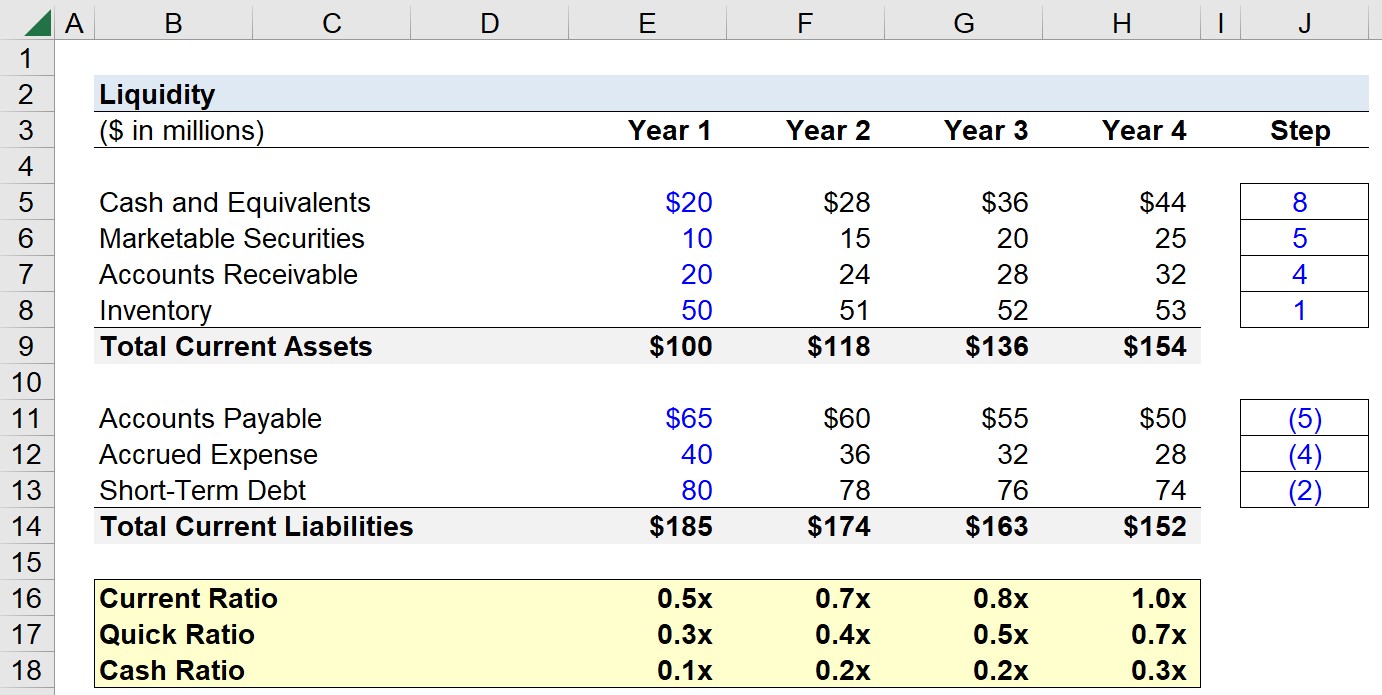
Suppose we’re tasked with performing liquidity analysis on a company with the following balance sheet data.
| Selected Balance Sheet Data | ||||
|---|---|---|---|---|
| ($ in millions) | Year 1 | Year 2 | Year 3 | Year 4 |
| Cash and Equivalents | $20 | $28 | $36 | $44 |
| Marketable Securities | 10 | 15 | 20 | 25 |
| Accounts Receivable | 20 | 24 | 28 | 32 |
| Inventory | 50 | 51 | 52 | 53 |
| Total Current Assets | $100 | $118 | $136 | $154 |
| Accounts Payable | $65 | $60 | $55 | $50 |
| Accrued Expense | 40 | 36 | 32 | 28 |
| Short-Term Debt | 80 | 78 | 76 | 74 |
| Total Current Liabilities | $185 | $174 | $163 | $152 |
2. Liquidity Risk Calculation Example
Since we’re limited to the balance sheet, we’ll calculate the current ratio, quick ratio, and cash ratio in each period.
Starting with the current ratio, the formula consists of dividing the “Total Current Assets” by the “Total Current Liabilities”.
- Current Ratio, Year 1 = 0.5x
- Current Ratio, Year 2 = 0.7x
- Current Ratio, Year 3 = 0.8x
- Current Ratio, Year 4 = 1.0x
From Year 1 to Year 4, the current ratio has expanded from 0.5x to 1.0x, which implies the company’s liquidity position is improving over time.
However, the current ratio can be misleading, because the build-up of inventory could potentially artificially “inflate” the liquidity ratio.
Thus, we’ll measure the quick ratio in the next step, where the only adjustment in the formula is that inventory is left out of the calculation.
- Quick Ratio, Year 1 = 0.3x
- Quick Ratio, Year 2 = 0.4x
- Quick Ratio, Year 3 = 0.5x
- Quick Ratio, Year 4 = 0.7x
3. Liquidity Risk Ratio Analysis
The positive trajectory in the quick ratio confirms that the company is indeed now in better shape from a near-term liquidity risk standpoint.
In the final part of our exercise, we’ll track the company’s cash ratio across the four-year period.
Of the three liquidity ratios, the cash ratio is by far the most conservative, since only the “Cash and Equivalents” line item is used in the formula.
- Cash Ratio, Year 1 = 0.1x
- Cash Ratio, Year 2 = 0.2x
- Cash Ratio, Year 3 = 0.2x
- Cash Ratio, Year 4 = 0.3x
In closing, we can reasonably derive from our exercise that the company’s financial state – particularly in the context of near-term liquidity – has improved over time, as confirmed by our liquidity ratios.

Everything You Need To Master Financial Modeling
Enroll in The Premium Package: Learn Financial Statement Modeling, DCF, M&A, LBO and Comps. The same training program used at top investment banks.
Enroll Today


