What is Incremental Margin?
The Incremental Margin measures the change in a profit metric per unit change in revenue, so conceptually it reflects the profit margin of growth.
How to Calculate Incremental Margin
A profit margin measures the percentage of a company’s net revenue remaining once certain expenses have been deducted.
Formulaically, most profit margin metrics are a ratio between a profitability metric and revenue, i.e. the “top line” of the income statement.
By comparing the profit metric to revenue, one can estimate a company’s profitability and identify its cost structure, i.e. where most of the company’s spending is allocated.
The profit margins of a given company can be compared to its industry peers to determine if the company operates more efficiently (or less efficiently) relative to its competitors.
The most common profit margin metrics are the following:
| Profit Margin | Formula | Description |
|---|---|---|
| Gross Margin | Gross Margin (%) = Gross Profit ÷ Revenue |
|
| Operating Margin | Operating Margin (%) = EBIT ÷ Revenue |
|
| EBITDA Margin | EBITDA Margin (%) = EBITDA ÷ Revenue |
|
| Net Profit Margin | Net Profit Margin (%) = Net Income ÷ Revenue |
|
Profit margins can be informative as standalone metrics, yet another method to analyzing the performance of companies is to calculate the incremental margin, which shows the direction that profit margins are moving as a result of changes in revenue.
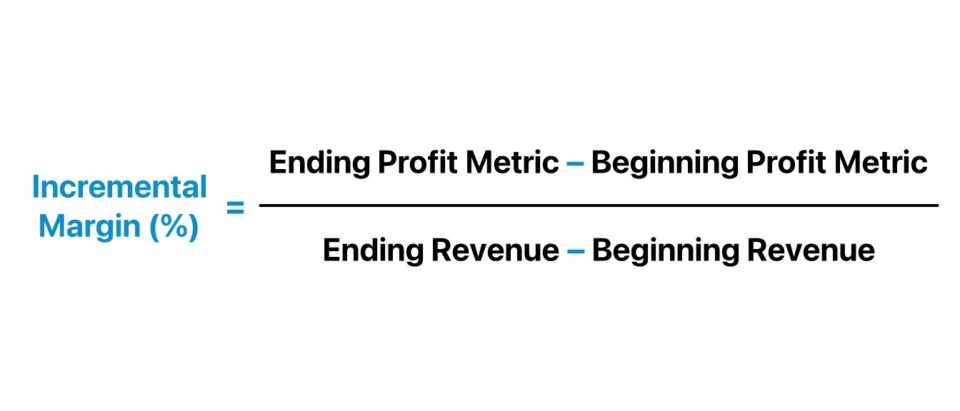
Incremental Margin Formula
The formula for calculating the incremental margin is as follows.
If, for example, we’re calculating the incremental EBITDA margin, we’ll replace the “Profit Metric” with “EBITDA”.
The Wharton Online & Wall Street Prep Applied Value Investing Certificate Program
Learn how institutional investors identify high-potential undervalued stocks. Enrollment is open for the Feb. 10 - Apr. 6 cohort.
Enroll TodayHow to Analyze Incremental Margin by Industry
In particular, the incremental margin is important for cyclical companies, where performance is tied to an external factor such as the current economic conditions.
For cyclical industries, such as manufacturing and industrials, strong margins are crucial because it reflects that a company can capitalize at the top of the cycle and manage its margins in a down cycle, where demand is reduced and margins are pressured.
Companies that have exhibited cyclical performance in the past must take into account their margin “cushion” because it determines the buffer it has if the economy were to undergo a contraction or enter a recession.
The incremental margin metric is also closely tied to the concept of operating leverage, as a company’s cost structure – i.e. proportion of fixed vs. variable costs – largely determines how its profit margins uphold throughout different economic cycles.
Learn More → Hedge Fund Primer
Incremental Margin Calculator
We’ll now move to a modeling exercise, which you can access by filling out the form below.
Incremental Margin Calculation Example
Suppose we’re tasked with calculating the incremental margin for a company from 2020 to 2021.
The financials of our hypothetical company are shown below, along with the associated profit margins.
| Operating Assumptions | ||
|---|---|---|
| ($ in millions) | 2020A | 2021A |
| Revenue | $100 million | $140 million |
| Less: COGS | (60 million) | (80 million) |
| Gross Profit | $40 million | $60 million |
| Gross Margin, % | 40.0% | 42.9% |
| Less: SG&A | (20 million) | (30 million) |
| EBITDA | $20 million | $30 million |
| EBITDA Margin, % | 20.0% | 21.4% |
| Less: D&A | (8 million) | (14 million) |
| EBIT | $12 million | $16 million |
| Operating Margin, % | 12.0% | 11.4% |
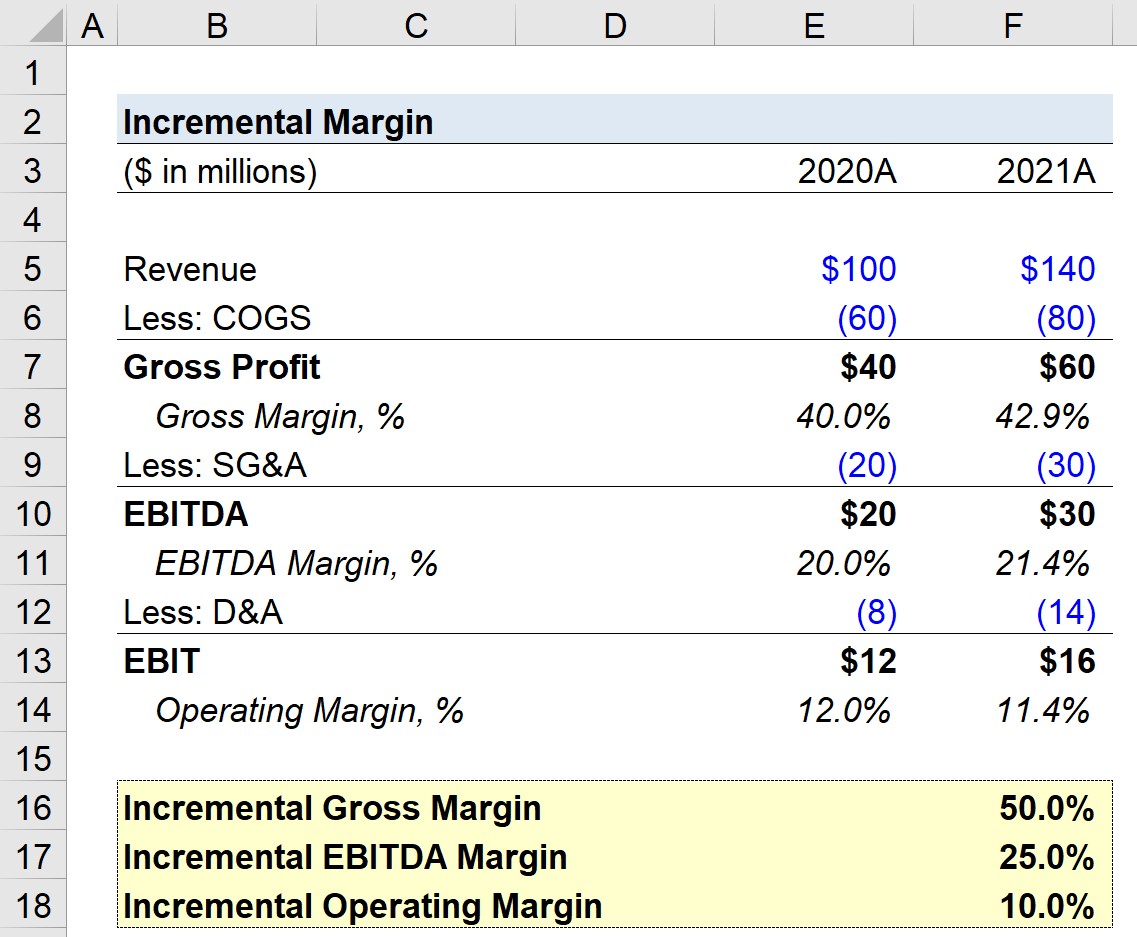
From 2020 to 2021, we can see that the gross margin expanded from 40.0% to 42.9%, while the EBITDA margin expanded from 20.0% to 21.4%.
However, the operating margin of our company, contrary to the gross margin and EBITDA margin, declined from 12.0% to 11.4%.
Our hypothetical company’s gross profit grew by $20 million year-over-year (YoY), while revenue increased from $100 million to $140 million.
If we focus solely on the year-over-year change – i.e. the incremental difference – the incremental gross margin is $20 million divided by $40 million, which comes out to 50.0%.
Since we have all the necessary inputs to calculate the incremental margins, we’ll apply the formula for each profit metric.
- Incremental Gross Margin = ($60 million – $40 million) ÷ ($140 million – $100 million) = 50.0%
- Incremental EBITDA Margin = ($30 million – $20 million) ÷ ($140 million – $100 million) = 25.0%
- Incremental Operating Margin = ($16 million – $12 million) ÷ ($140 million – $100 million) = 10.0%