What is Gross Margin?
The Gross Margin represents the amount of revenue left over after deducting the cost of goods sold (COGS) incurred in the period.
Since only direct costs are accounted for in the metric, the gross margin shows how much in profits remains available for meeting fixed costs and other non-operating expenses.

How to Calculate Gross Margin?
Calculating a company’s gross margin involves dividing its gross profit by the revenue in the matching period, which are both metrics found on the GAAP-based income statement.
The gross margin metric answers the following question, “How much in gross profits is kept for each dollar of revenue?”
- Gross Profit → The gross profit metric represents the remaining revenue after subtracting direct costs (COGS)
- Cost of Goods Sold (COGS) → The direct costs incurred by a company that are directly tied to the production and delivery of specific goods and/or services (and are typically variable costs).
In accordance with GAAP accounting standards, the cost of goods sold (COGS) are matched to the associated revenues in the same time period, which is commonly known as the “matching principle”.
Common examples of costs recognized under the cost of goods sold (COGS) line item include the following:
- Direct Labor Costs
- Purchase of Materials (i.e. Inventory)
The process of calculating the gross profit margin is as follows:
- Step 1 → First, we must take the net revenue and the cost of goods sold (COGS) figures from the income statement.
- Step 2 → Next, we’ll calculate the gross profit by subtracting COGS from revenue.
- Step 3 → Lastly, we’ll divide the gross profit of each company by the amount of revenue in the corresponding period to quantify the gross profit margin.
Gross Margin Formula
The formula to calculate the gross profit margin is as follows.
In order to express the metric in percentage form, the resulting decimal value figure must be multiplied by 100.
For example, if a company has generated $10 million in revenue with $3 million in COGS, the gross profit is $7 million.
- Revenue = $10 million
- Cost of Goods Sold (COGS) = $3 million
- Gross Profit = $7 million
Upon dividing the $7 million in gross profit by the $10 million in revenue and then multiplying by 100, we arrive at 70% as our GM %. Based on the 70% GM, we can gather that the company has earned $0.70 in gross profit for each $1.00 of revenue.
- Gross Profit Margin (%) = $7 million / $10 million = 0.70, or 70%
What is a Good Gross Profit Margin?
Interpreting a company’s gross margin as either “good” or “bad” depends substantially on the industry in which the company operates. For any comparisons to be useful, the companies must operate in the same or similar industry with available historical data dating back several years to get a better sense of the industry norm (and patterns).
- High Gross Profit Margin (%): For example, software companies have been known for having high gross margins, while clothing retailers have historically exhibited razor-thin gross margins and rely on volume to remain profitable. Service-based industries also tend to have higher gross margins since the COGS for such businesses are minimal (e.g. consulting firms).
- Low Gross Profit Margin (%): In contrast, capital-intensive companies (e.g. manufacturing, industrials, retail) normally have lower gross margins due to margin erosion from the direct costs related to building up inventory, manufacturing products, etc. Nevertheless, such industries with significant direct costs can still consist of market leaders with consistent profits that retain meaningful market shares (e.g. airlines, transportation, retail).
As one would reasonably expect, higher gross margins are usually viewed in a positive light, as the potential for higher operating margins and net profit margins increases. An accurate assessment of the gross profit metric depends, however, on understanding the industry dynamics and the company’s current business model.
Learn More → Profit Margins by Sector (Damodaran)
How to Increase Gross Margin?
A couple of common methods for companies to improve their gross margin are the following:
- Increase Average Selling Price (ASP) – Requires Pricing Power, Upselling, etc.
- Purchase Inventory at Lower Prices – Requires Negotiating Leverage with Suppliers (e.g. High Order Volume/Frequency, Bulk Purchases, Branding)
- Integrate Higher Margin Products/Services – Adding New Products/Services with Higher Gross Margins Could Lead to Improved Customer Retention and Cross-Selling Opportunities
Apple (AAPL) Gross Profit: Income Statement Example
Apple’s gross profit line item is highlighted in the screenshot below.
The only adjustment made to Apple’s revenue each fiscal year is “Cost of Sales”, as we discussed earlier.
Once deducted, the gross margin percentage can be computed by dividing gross profit by the amount of revenue generated in the corresponding period.
 Apple Gross Profit (Source: WSP Financial Statement Modeling)
Gross Margin vs. Net Profit Margin: What is the Difference?
The gross profit margin only accounts for direct costs (i.e. COGS), while the net profit margin accounts for all expenses, including operating expenses and non-operating expenses.
The fact that net income is “levered” (i.e. post-debt) and flows solely to equity holders is one of the primary drawbacks to the net margin metric.
In contrast, the gross profit margin accounts for just one outflow of cash, which is the direct costs associated with the production of revenue.
The gross profit margin, unlike the net margin, is largely unaffected by financing decisions or discretionary accounting policies such as useful life assumptions for purchases of PP&E or differences in the tax rate, making it better suited for peer comparisons since there is a far lower potential for manipulation via discretionary accounting decisions by management.
Gross Margin Calculator
We’ll now move to a modeling exercise, which you can access by filling out the form below.
1. Income Statement Assumptions
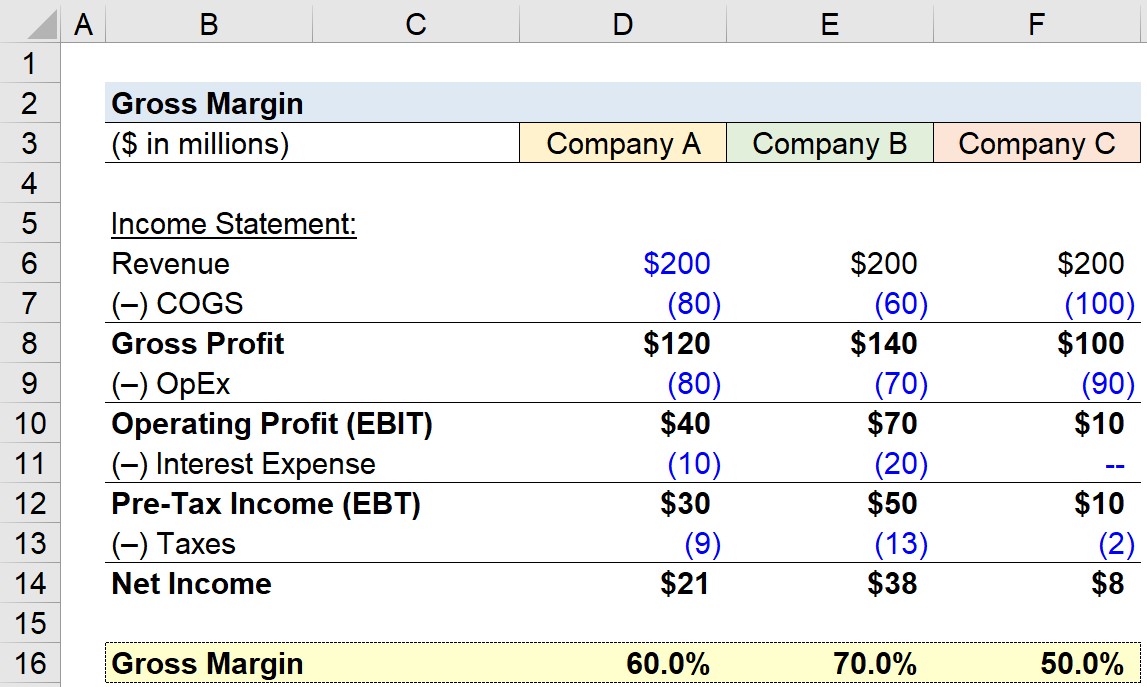
For our example modeling exercise, we’ll be calculating and comparing the gross profit margin of three companies, with each having different revenue and COGS assumptions.
We’ll start by listing out the revenue and cost of goods sold (COGS) assumptions for each company.
Income Statement – Company A
- Revenue = $200m
- Cost of Goods Sold (COGS) = –$80m
Income Statement – Company B
- Revenue = $200m
- Cost of Goods Sold (COGS) = –$60m
Income Statement – Company C
- Revenue = $200m
- Cost of Goods Sold (COGS) = –$100m
2. Gross Profit and Gross Margin Calculation
Using these figures, we can calculate the gross profit for each company by subtracting COGS from revenue.
- Gross Profit, Company A: $200m – $80m = $120m
- Gross Profit, Company B: $200m – $60m = $140m
- Gross Profit, Company C: $200m – $100m = $100m
Next, the gross profit would be divided by revenue to get the gross margin.
- GM Ratio (%), Company A: $200m ÷ $120m = 60.0%
- GM Ratio (%), Company B: $200m ÷ $140m = 70.0%
- GM Ratio (%), Company C: $200m ÷ $100m = 50.0%
3. Gross Profit Margin Ratio Analysis
Despite the differences in operating expenses (OpEx), interest expenses, and tax rates among these companies, none of these differences are captured in the gross margin.
The gross margin isolates the profits only after COGS is factored in, which makes the metric more informative for peer group comparisons.
Since COGS were already taken into account, the remaining funds are available to be used to pay operating expenses (OpEx), interest expenses, and taxes.
For instance, the operating profit margin, which accounts for COGS and OpEx, is 20% for Company A, 35% for Company B, and 5% for Company C.
As in the case of all profitability metrics, the gross margin should be used in conjunction with other metrics to fully understand the cost structure and business model of the company.