
- What is Gross Profit?
- How to Calculate Gross Profit
- Gross Profit Formula
- What is a Good Gross Profit?
- How to Find Gross Profit on the Income Statement?
- Gross Profit vs. Net Income: What is the Difference?
- How to Forecast Gross Profit?
- Gross Profit Calculator
- 1. Historical Income Statement Data
- 2. Gross Profit Analysis Per Division Example
- 3. Gross Profit Calculation Example
What is Gross Profit?
The Gross Profit metric reflects the earnings remaining once a company’s cost of goods sold (COGS) are deducted from its net revenue.
More specifically, the gross profit metric is the income left over after all direct expenses related to the production of a good or delivery of a service to generate sales have been subtracted from revenue.
- The gross profit is the difference between the net revenue of a company and its cost of goods sold (COGS) incurred in the matching period.
- The formula to calculate gross profit subtracts a company's cost of goods sold (COGS) from its net revenue.
- The "Gross Profit" is recognized near the top of a company's income statement, wherein the gross profit is the first profit metric upon deducting COGS from net revenue.
- The gross profit metric can be standardized by dividing by net revenue, resulting in gross margin, which facilitates comparisons among industry peers to determine the company's operating efficiency and understanding its cost structure (i.e. fixed vs. variable costs).
How to Calculate Gross Profit
On the income statement, the gross profit line item appears underneath cost of goods (COGS), which comes right after revenue (i.e. the “top line”).
- Net Revenue → The total monetary value of the goods and/or services sold by a company in a specified period, as recognized per accrual accounting standards.
- Cost of Goods Sold (COGS) → COGS are the direct costs associated with producing a good or delivering a service.
Indirect costs, such as operating expenses and non-core expenses, do not affect gross profit, contrary to direct costs.
- Direct Costs → e.g. Direct Materials, Overhead Costs, Direct Labor
- Indirect Costs → e.g. Selling, General and Administrative (SG&A), Research and Development (R&D)
Conceptually, the gross income metric reflects the profits available to meet fixed costs and other non-operating expenses.
The gross profit of a company can be increased using four primary methods:
- Increase Average Order Value (AOV) → Requires Pricing Power, Upselling or Cross-Selling Opportunities, Product Bundling, etc.
- Reduce Inventory Purchase Prices → Requires Buy Power and Negotiating Leverage with Suppliers and Vendors (e.g. High Order Volume, Frequent Orders, Bulk Purchases, Branding)
- Higher Margin Per-Unit Sales → Integrating Products/Services with Higher Profit Margins into Existing Offerings can Improve Pricing (i.e. Software Capabilities)
- Economies of Scale → More Units Sold and Higher Output Can Potentially Cause the Incremental Costs Incurred Per Unit to Reduce from the Increased Scale of the Company’s Operations
Gross Profit Formula
The formula for calculating the gross profit is as follows.
As a standalone metric, the gross income is not too meaningful. Hence, the profit metric must be standardized by converting it into percentage form.
The formula for the gross margin is the company’s gross profit divided by the revenue in the matching period.
The gross margin is the percentage of a company’s revenue remaining after subtracting COGS (e.g. direct materials, direct labor).
Moreover, the gross margin facilitates comparisons between industry peers and comparable companies, as well as for performing year-over-year (YoY) analyses.
What is a Good Gross Profit?
Classifying a company’s gross profit as “good” is entirely contingent on the industry that the company operates within and the related contextual details.
But before any comparisons can be made, the gross profit must be standardized by dividing the metric by revenue.
Generally speaking, a company with a higher gross margin is perceived positively, as the potential for a higher operating margin (EBIT) and net profit margin rises.
Otherwise, any side-by-side analysis of comparable companies is distorted by differences in size, among other factors.
Therefore, like the use of valuation multiples on comps analysis, the gross profit must be converted into a percentage, i.e. the gross margin, as we illustrated earlier.
But to reiterate, comparisons of a company’s gross margins must only be done among comparable companies (i.e. to be “apples-to-apples”).
How to Find Gross Profit on the Income Statement?
As a real-life example, the gross margin of Apple (NASDAQ: AAPL), which refers to the dollar amount, from fiscal years 2019 to 2021, is as follows.
- Gross Margin, 2019 → $260,174 million – $161,782 million = $98,392 million
- Gross Margin, 2020 → $274,515 million – $169,559 million = $104,956 million
- Gross Margin, 2021 → $365,817 million – $212,981 million = $152,836 million
Note: The income statement of Apple states gross margin, rather than gross profit. While most tend to associate gross “margin” with a profit margin, i.e. a percentage or ratio, others use the two terms interchangeably.
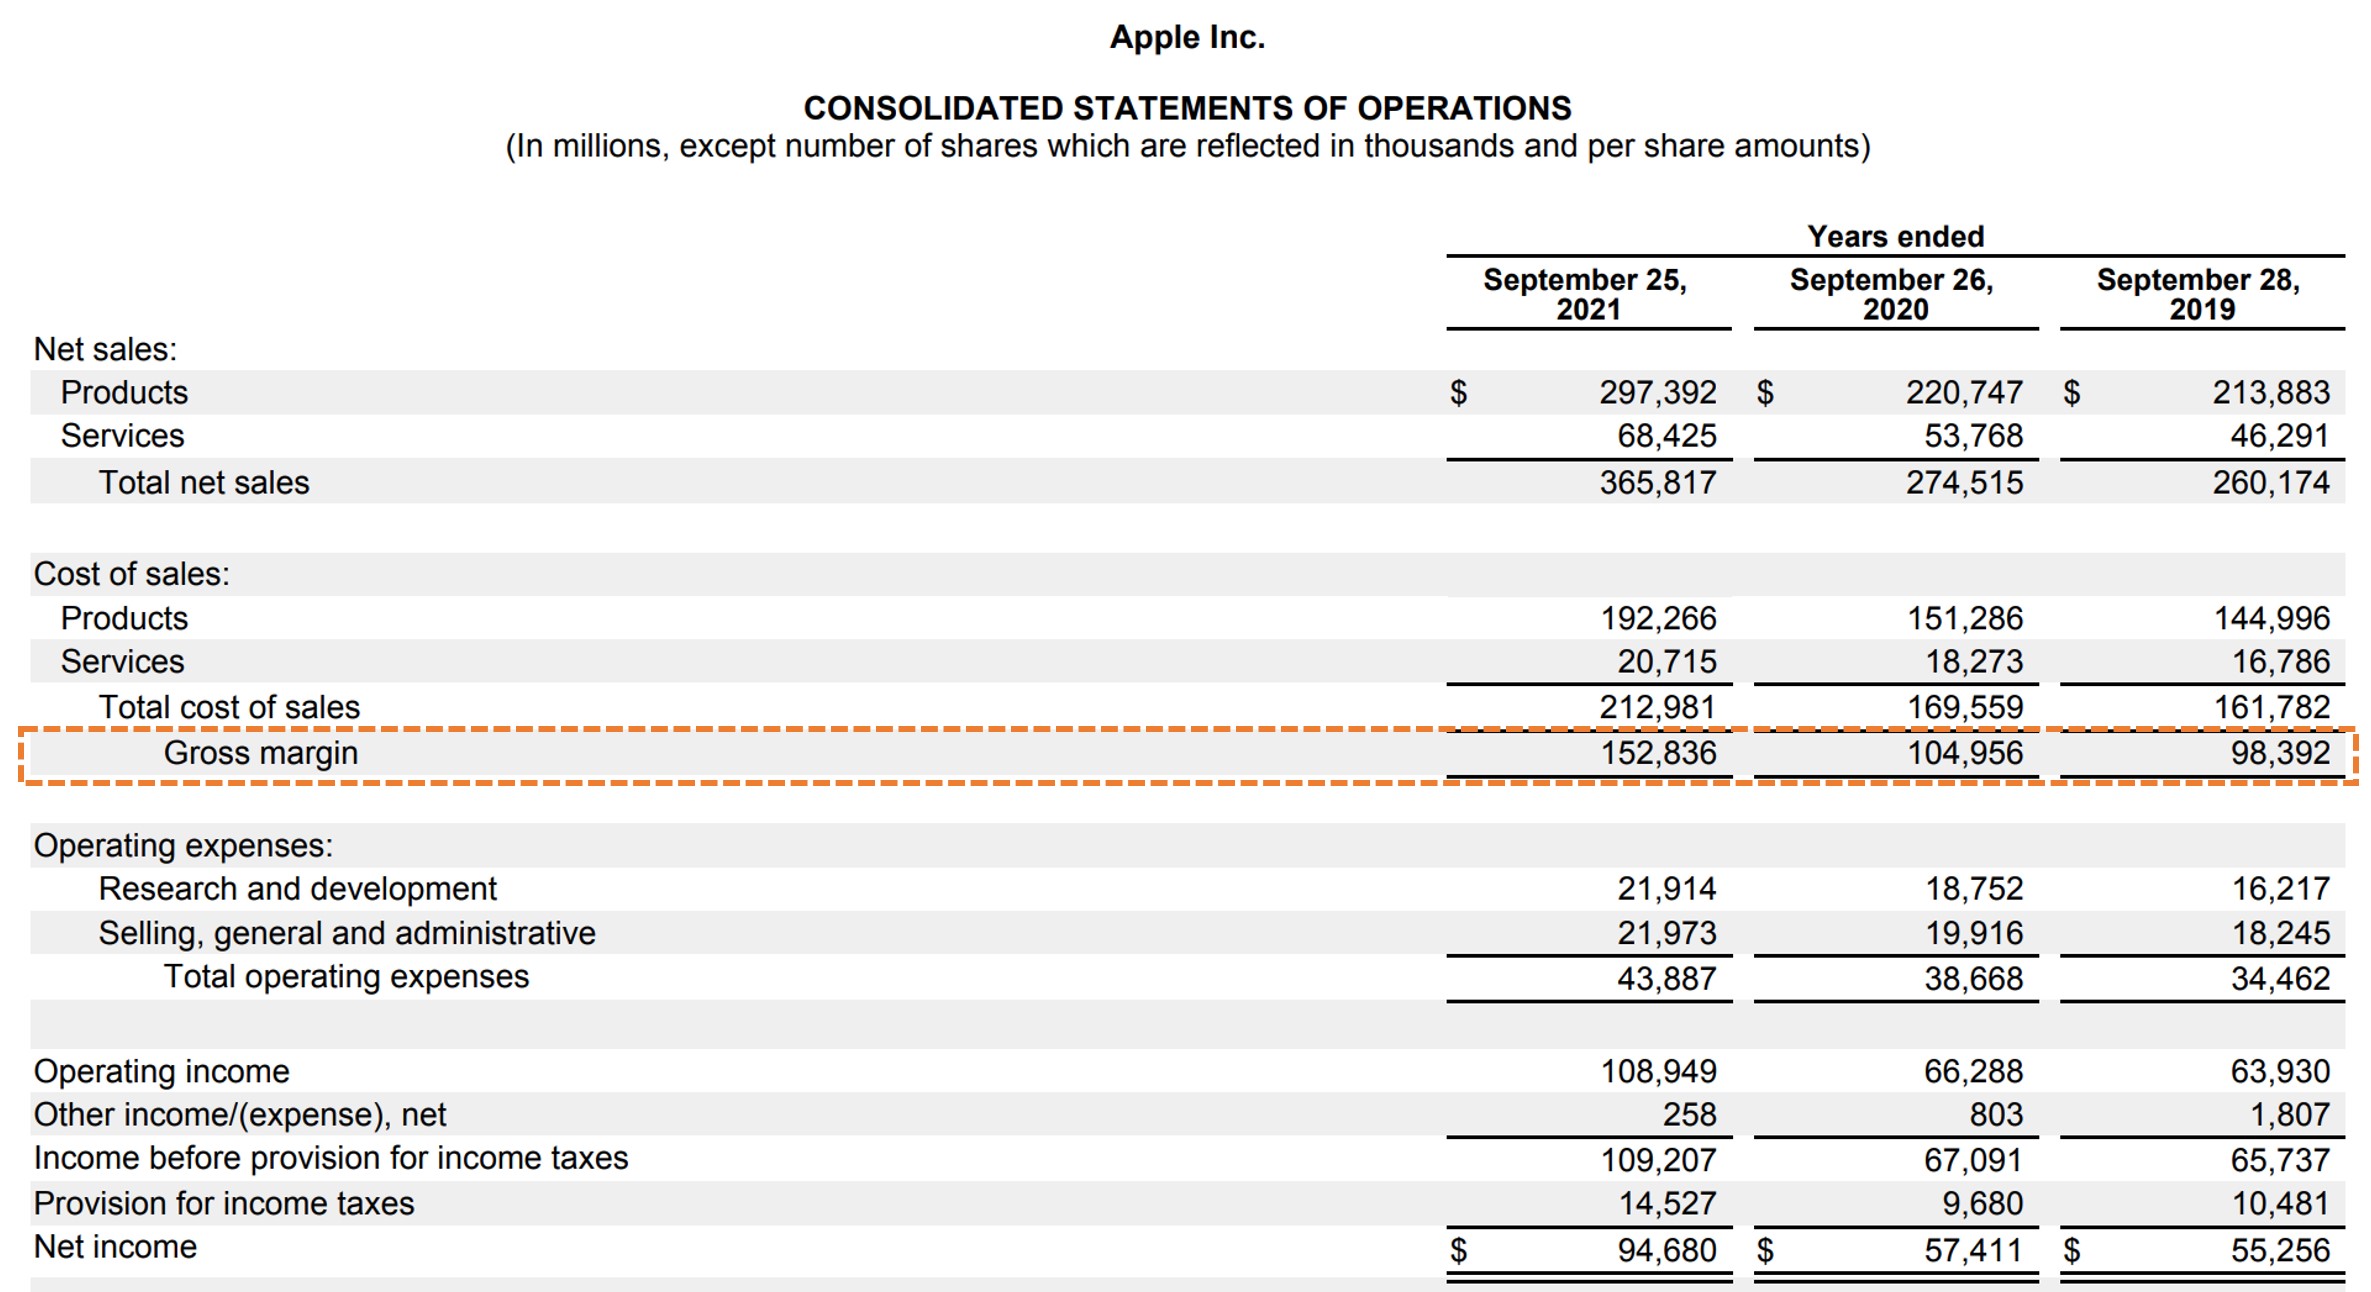
Apple Gross Margin (Source: AAPL 10-K)
In recent years, Apple has shifted its focus from hardware to software sales, especially since it has become increasingly difficult for Apple to provide a sufficient incentive for customers to upgrade to newer hardware (i.e. phone or laptop) models.
Unlike software and related services — which represent sources of recurring revenue — hardware products are one-time purchases.
Therefore, considering the larger total addressable market (TAM) for software, the reasoning for Apple’s shift toward strengthening its online service offerings and integrating the Apple ecosystem (e.g. iOS App Store, iCloud, iTunes, Apple Music, Macs) is not surprising.
Gross Profit vs. Net Income: What is the Difference?
The difference between gross profit and net income is as follows.
- Net Income → The net income, i.e. the “bottom line” of the income statement, is the profit metric that accounts for all expenses, including operating expenses such as COGS and SG&A, as well as non-operating expenses like interest and taxes. While the gross income metric only accounts for COGS, net income is a levered metric (i.e. post-debt), since it is affected by interest expense and is only attributable to shareholders with equity stakes in the company.
- Gross Profit → In contrast, a company’s gross profit subtracts just one outflow of cash, the direct costs associated with the core generation of revenue. The gross income metric is thus far better suited for peer-to-peer comparisons, because it is mostly unaffected by financing decisions or discretionary accounting policies (e.g. the useful life assumptions on PP&E that determine the annual depreciation expense, jurisdiction-dependent differences in the tax rate, NOLs).
One major drawback to the net income metric — other than the fact that it is a post-debt profit metric — is that non-operating income / (expenses) can also distort net income, such as interest income, interest expense, gains or losses of asset sales, and inventory or PP&E write-offs.
How to Forecast Gross Profit?
To forecast a company’s gross profit, the most common approach is to assume the company’s gross margin (GM) percentage based on historical data and industry comparables.
The gross margin assumption is then multiplied by the revenue assumptions in the corresponding period.
Since that leaves the cost of goods sold (COGS) line item blank, the next step would be to subtract the projected gross income from revenue, which should result in COGS
An alternative approach is to subtract the gross margin from one to arrive at the COGS margin, i.e. COGS as a percentage of revenue.
The COGS margin would then be multiplied by the corresponding revenue amount.
Gross Profit Calculator
We’ll now move to a modeling exercise, which you can access by filling out the form below.
1. Historical Income Statement Data
Suppose we’re tasked with calculating the gross profit and gross margin of Apple (AAPL) as of its past three fiscal years.
The historical net sales and cost of sales data reported on Apple’s latest 10-K is posted in the table below.
| Apple (AAPL) Historical Data | |||
|---|---|---|---|
| ($ in millions) | 2019A | 2020A | 2021A |
| Net Sales: | |||
| Products | $213,883 | $220,747 | $297,392 |
| Services | 46,291 | 53,768 | 68,425 |
| Total Net Sales | $260,174 | $274,515 | $365,817 |
| Cost of Sales: | |||
| Products | ($144,996) | ($151,286) | ($192,266) |
| Services | (16,786) | (18,273) | (20,715) |
| Total Cost of Sales | ($161,782) | ($169,559) | ($212,981) |
2. Gross Profit Analysis Per Division Example
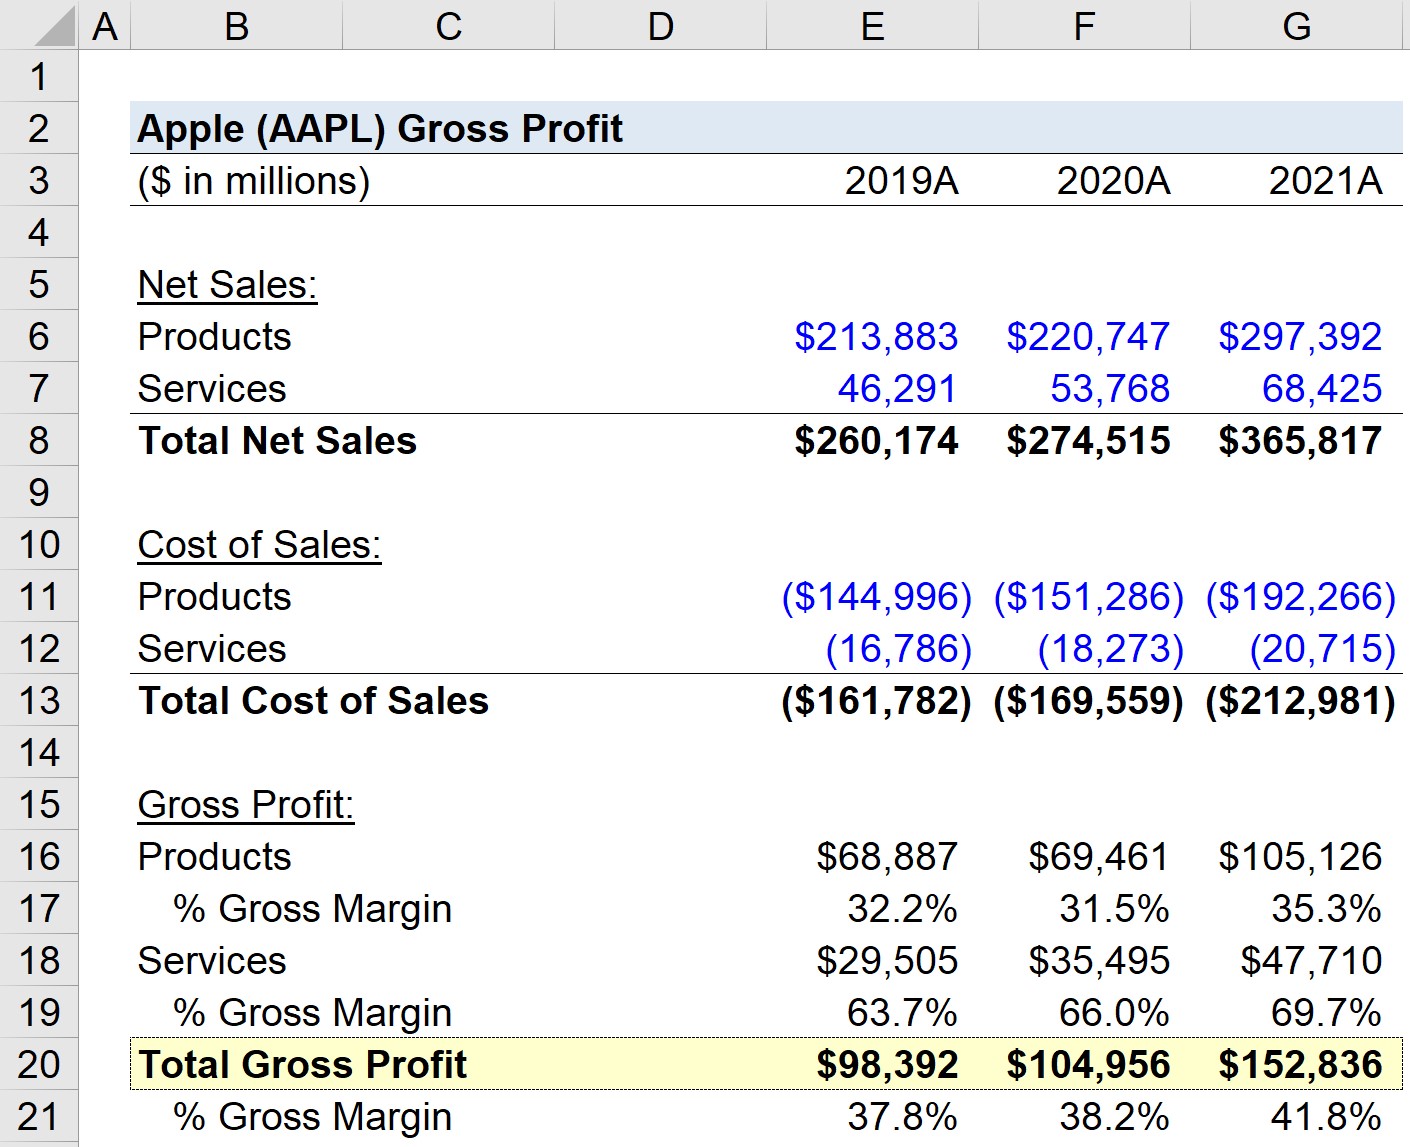
In our model, we’ll calculate the gross profit and gross margin metrics separately for the products and services division.
Apple (AAPL) – Products Division
- Gross Profit, 2019A = $68,887 million (32.2% Gross Margin)
- Gross Profit, 2020A = $69,461 million (31.5% Gross Margin)
- Gross Profit, 2021A = $105,126 million (35.3% Gross Margin)
Apple (AAPL) – Services Division
- Gross Profit, 2019A = $29,505 million (63.7% Gross Margin)
- Gross Profit, 2020A = $35,495 million (66.0% Gross Margin)
- Gross Profit, 2021A = $47,710 million (69.7% Gross Margin)
The differences in gross margins between products vs. services are 32%, 35%, and 34% in the three-year time span, reflecting how services are much more profitable than physical products.
3. Gross Profit Calculation Example
In the final part of our modeling exercise, we’ll calculate the total gross profit and gross margin of Apple, which blends the profits (and margins) of both the products and services divisions.
Apple (AAPL) – Total Gross Profit
- Gross Profit, 2019A = $98,392 million (37.8% Gross Margin)
- Gross Profit, 2020A = $104,956 million (38.2% Gross Margin)
- Gross Profit, 2021A = $152,836 million (41.8% Gross Margin)
From 2019 to 2021, Apple’s gross margin averaged approximately 39%, yet from our analysis, the company’s margins are particularly weighted down by the “Products” division.
Generally, the gross profits kept by a technology company such as Apple (AAPL) tend to be higher for “Services” relative to “Products”, which can be confirmed by Apple’s historical gross margin in the trailing three fiscal years.

Everything You Need To Master Financial Modeling
Enroll in The Premium Package: Learn Financial Statement Modeling, DCF, M&A, LBO and Comps. The same training program used at top investment banks.
Enroll Today


