
What are Fixed Costs?
Fixed Costs are independent of output and its dollar amount remains constant irrespective of a company’s production volume.
How to Calculate Fixed Costs
Fixed costs are output-independent, and the dollar amount incurred remains around a certain level regardless of changes in production volume.
Fixed costs are not linked to production output, so these costs neither increase nor decrease at different production volumes.
A company’s costs classified as “fixed” are incurred periodically, so there is a set schedule and dollar amount attributable to each cost.
Whether the demand for a particular company’s products/services (and production volume) is above or below management expectations, these types of costs remain the same.
For instance, a company’s monthly office rent would be an example, since no matter whether a company’s sales in a particular period are positive or sub-par — the monthly rental fee charged is pre-determined and based on a signed contractual obligation between the relevant parties.
Fixed Cost vs. Variable Cost: What is the Difference?
A fixed cost, contrary to a variable cost, must be met irrespective of the sales performance and production output, making them much more predictable and easier to budget for in advance.
Unlike variable costs, which are subject to fluctuations depending on production output, there is no or minimal correlation between output and total fixed costs.
- Fixed Cost → The cost remains the same regardless of the production output
- Variable Cost → The cost is directly tied to production volume and fluctuates based on the output
But in the case of variable costs, these costs increase (or decrease) based on the volume of output in the given period, causing them to be less predictable.
Fixed Cost Formula
A company’s total costs are equal to the sum of its fixed costs (FC) and variable costs (VC), so the amount can be calculated by subtracting total variable costs from total costs.
The Wharton Online & Wall Street Prep Applied Value Investing Certificate Program
Learn how institutional investors identify high-potential undervalued stocks. Enrollment is open for the Feb. 10 - Apr. 6 cohort.
Enroll TodayFixed Cost Per Unit Formula
The fixed cost per unit is the total amount of FCs incurred by a company divided by the total number of units produced.
The per unit variation is calculated to determine the break-even point, but also to assess the potential benefit of economies of scale (and how it can impact pricing strategy).
Suppose a company incurred $120,000 in FC during a given period while producing 10,000 widgets. Here, the company’s FC per unit is $12.50 per unit.
If the company scales and produces more widgets, the fixed cost per unit declines, giving the company the flexibility to cut prices while retaining the same profit margins as before.
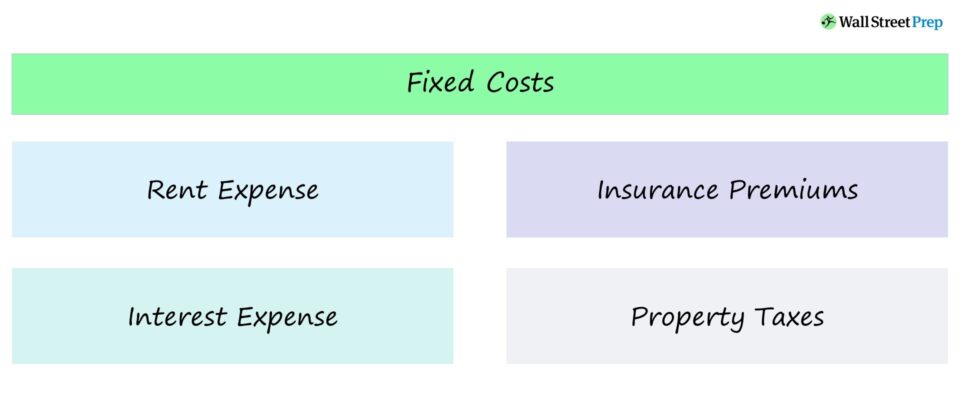
What are Examples of Fixed Costs?
Common examples of fixed costs in business are the following:
- Rent Expense
- Warehousing
- Insurance Premium
- Equipment
- Utilities
- Salaries
- Interest Expense
- Accounting and Legal Costs
- Property Taxes
How Do Fixed Costs Impact Operating Leverage?
Operating leverage refers to the percentage of a company’s total cost structure that consists of fixed rather than variable costs.
- High Operating Leverage → If a company has a higher proportion of fixed costs than variable costs, the company would be considered to have high operating leverage.
- Low Operating Leverage → If a company has a lower proportion of fixed costs than variable costs, the company would be considered to have low operating leverage.
As a company with high operating leverage generates more revenue, more incremental revenue trickles down to its operating income (EBIT) and net income.
The downside to operating leverage is if customer demand and sales underperform, the company has limited areas for cost-cutting since regardless of performance, the company must continue paying its costs that are fixed.
How Do Fixed Costs Affect the Break Even Point?
The break-even point is the required output level for a company’s sales to equal its total costs, i.e. the inflection point where a company turns a profit.
The break-even point formula consists of dividing a company’s fixed costs by its contribution margin, i.e. sales price per unit minus variable cost per unit.
The greater the percentage of total costs that are fixed in nature, the more revenue must be brought in before the company can reach its break-even point and start generating profits.
In effect, companies with high operating leverage take on the risk of failing to produce enough revenue to profit, but more profits are brought in beyond the break-even point.
Companies with business models characterized as having high operating leverage can profit more from each incremental dollar of revenue generated beyond the break-even point.
Since each marginal sale requires fewer incremental costs, having high operating leverage can be very beneficial to a company’s profit margins as long as the amount of sales is adequate and the threshold for minimum quantity is met.
On the other hand, if the company’s revenue declines, high operating leverage could be detrimental to its profitability due to the company being restricted in its ability to implement cost-cutting measures.
Operating leverage is a double-edged sword, where the potential for greater profitability comes with the risk of a greater chance of insufficient revenue (and being unprofitable).


