
- Sensitivity Analysis: “What if” Analysis
- General Rule of Thumb in Sensitivity Analysis
- Data Table Format: Endless Possibilities in Analysis
- Sensitivity Analysis Data Table – Excel Template
- Building the Data Table: Initial Set-Up
- Constructing the Matrix in Excel
- Sensitivity Analysis: Functioning Data Table Results
Sensitivity Analysis: “What if” Analysis
A financial model is a great way to assess the performance of a business on both a historical and projected basis. It provides a way for the analyst to organize a business’s operations and analyze the results in both a “time-series” format (measuring the company’s performance against itself over time) and a “cross-sectional” format (measuring the company’s performance against industry peers).
Typically, once an analyst inputs both historical financial results and assumptions about future performance, he/she can then calculate and interpret various ratio analyses, and other operational performance metrics such as profit margins, inventory turnover, cash collections, leverage and interest coverage ratios, among others.
General Rule of Thumb in Sensitivity Analysis
A scenario manager allows the analyst to “stress-test” the financial results because the reality is that expectations can and usually do change over time.
In previous articles, we discussed the fact that these forward-looking assumptions may not always hold true, and that the use of a scenario manager is a great way to incorporate several performance possibilities into your financial model. This allows the analyst to “stress-test” the financial results because the reality is that expectations can and often do change over time. Because the future cannot be predicted with any certainty, it’s never a good idea to take your financial model’s results and claim, either to your boss or to your client, that the results are final.
So what can you do if the financial model’s results are not the final results? Isn’t that why you build a model in the first place — to get some clarity or answer as to the future performance of the business? Yes and no. The purpose of the financial model is to provide some insight into future performance, but there is no one correct answer. Clients and managing directors like to see a range of possible outcomes, and this is where the sensitivity analysis, or “what-if” analysis comes into play.
Data Table Format: Endless Possibilities in Analysis
It’s not unusual for a client to never even look at a financial model and opt to see the results presented in a data table format.
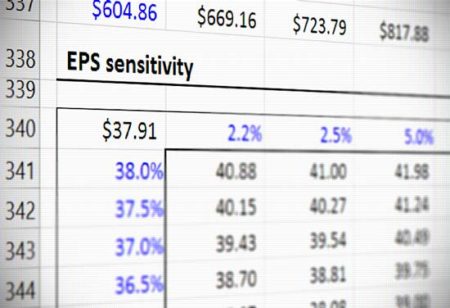
A sensitivity analysis, otherwise known as a “what-if” analysis or a data table, is another in a long line of powerful Excel tools that allows a user to see what the desired result of the financial model would be under different circumstances. It allows the user to select two variables, or assumptions, in the model and see how a desired output, such as earnings per share (a common metric used) would change based on the new assumptions. It is the perfect complement to a scenario manager, adding even more flexibility to one’s financial and valuation models when it comes to analysis and presentation.
In fact, it’s not unusual for a client to never even look at a financial model and opt to see the results presented in a data table format along with select financial data. This is why it’s important for the analyst to understand the mechanics of creating the data table and be able to interpret its results to make sure the analysis is working properly. We shall go over the mechanics of the data table next.
Sensitivity Analysis Data Table – Excel Template
Use the form below to download our sample Data Table:
Building the Data Table: Initial Set-Up
Let’s say, for example, that you have built a dynamic financial statement model in order to predict future earnings per share (EPS) for your business. Your model is flawlessly constructed and gives you an EPS result of $2.63 for the year 2009. Now, instead of presenting to your client that the answer to the question “What will EPS be in 2009?” is unquestionably going to be $2.63, it makes more sense to present a range of possibilities for 2009 EPS that depend on sensitizing certain assumptions in the model. Let’s look at an actual example below to illustrate our point:
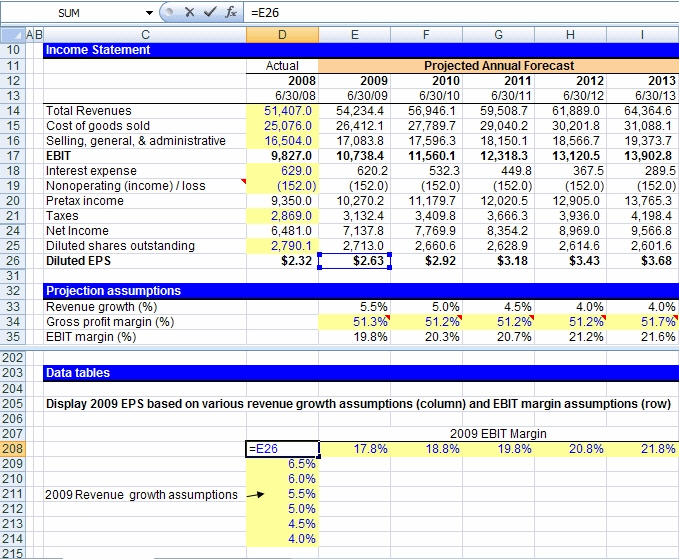
Constructing the Matrix in Excel
- In a cell on the worksheet, reference the formula that refers to the two input cells that we would like to sensitize. In cell D208, we have referenced our EPS for 2009.
- Type one list of input values in the same column, below the formula. In the example, we have input a range of revenue growth assumptions.
- Type the second list in the same row, to the right of the formula. In the example, we have input a range of EBIT margin assumptions.
- Select the range of cells that contains the formula and both the row and column of values. In the example below, you would select the range D208:I214.
- Hit the keys Alt-D-T on your keyboard. This will pull up the “Data Table” box as shown to the right of the data table, below. Note: This “shortcut” works in both Excel 2003 and 2007, although an alternative would be to hit Alt-A-W-T for the 2007 version, which will direct you to the data table box through the “What-If Analysis” menu.
- In the Row input cell box, enter the reference to the input cell for the input values in the row. In the example below, you would type cell E35 in the Row input cell box.
- In the Column input cell box, enter the reference to the input cell for the input values in the column. In the example below, you would type E33 in the Column input cell box.
- Click OK!
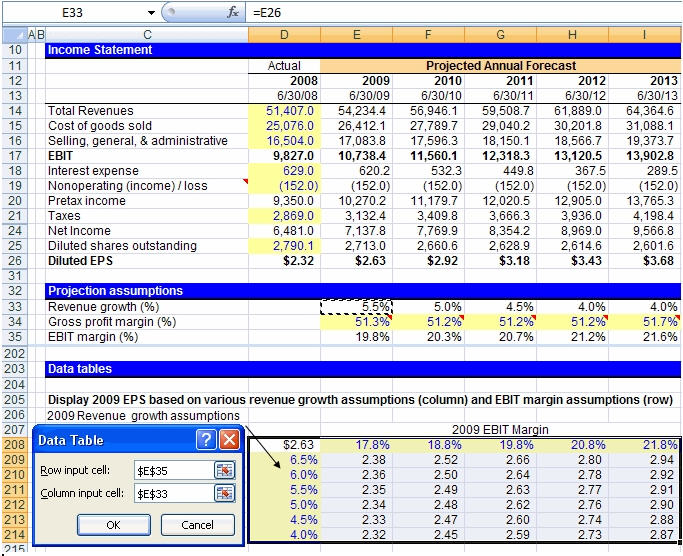
Sensitivity Analysis: Functioning Data Table Results
We will finally get our various diluted EPS results as seen in cells E209 through I214 in the data table. The only thing left to do now is to sanity check the results. As revenue growth increases, we should see an increase in diluted EPS, and we do. We should also see diluted EPS increase as EBIT margin improves, and we do. It looks as though we have constructed a well-functioning data table!
Aside from our data table matrix, another method to perform a sanity check on a forecasted figure like revenue is the compound annual growth rate (CAGR). The annualized growth rate metric can be determined to confirm it is reasonable, which is based on the company’s historical growth rate and the industry average among comparable companies.
One thing to know is that sometimes Excel is set to calculate automatically, except for data tables. If it looks as though your data table is not working, try hitting “F9” to recalculate the entire worksheet. You can also adjust how Excel is set up by hitting Alt-T-O and then going to the “Calculations” tab in Excel 2003 or the “Formulas” section in Excel 2007. You can also hit Alt-M-X in Excel 2007 to make your selection.
In conclusion, performing sensitivity analysis via a data table is an effective and easy way to present valuable financial information to a boss or client. It provides a range of possible outcomes for a particular piece of information and can highlight the margin of safety that might exist before something goes terribly wrong. For example, how low can revenue growth or EBIT margins get before EPS becomes negative? Once you have constructed several data tables, you’ll realize that it takes no time at all and that there is no excuse for not incorporating them into your financial modeling arsenal.

Everything You Need To Master Financial Modeling
Enroll in The Premium Package: Learn Financial Statement Modeling, DCF, M&A, LBO and Comps. The same training program used at top investment banks.
Enroll Today


So the analysis can be carried with maximum 2 variables? How can we test if we want to try 3 variables (EBIT margin, revenue growth plus another variable)?
Thank you
Can the sensitivity analysis data table be on a different sheet from where the basic model is? When I try that, Excel gives me an error “Input cell reference is not valid.” However, the same data table works fine on the same sheet as the basic model. Thank you for… Read more »
Can you do just one variable?
Hi I am having an issue with my data tables, the value in the middle of the table, which is supposed to the same value as the one on the top left hand corner comes out different even if the one in the top left corner is calculated using the… Read more »
Hi there, thanks for the resource!
I’m having some trouble getting the results. I used Alt A W T and input the two cells, however, the results I got are all dash lines. Could you help with that please? Thanks so much
Hi, may I know where is the excel file for download? Can’t find the link, or can you send me?
Thanks!
Dears,
Thank you for the knowledge sharing.
Please how do I apply this technique on a financial statement that is built on monthly basis.
Warm regards.
Great tutorial you couldn’t have made it easier. Thank you:)
Hi,
I applied the above to one sensitivity exercise that i was working on, however, at times, the same values appear throughout the table. Why is that so? and how should i rectify that?