
- What is Contribution Margin?
- How to Calculate Contribution Margin
- Contribution Margin Formula
- Contribution Margin Ratio Formula
- Contribution Margin vs. Gross Margin: What is the Difference?
- Contribution Margin Calculator — Excel Template
- 1. Operating Assumptions
- 2. Contribution Margin Calculation Example
- 3. Contribution Margin Ratio Calculation Example
- 4. Contribution Margin Analysis Per Unit Example
What is Contribution Margin?
The Contribution Margin is the incremental profit earned on each unit of product sold, calculated by subtracting direct variable costs from revenue.
Since the associated variable costs are accounted for, the contribution margin represents the remaining revenue left to pay for fixed costs and other non-operating expenses.
- Contribution margin reflects the incremental profit per unit, calculated by subtracting variable costs from revenue.
- Conceptually, the contribution margin reflects the remaining revenue available to cover fixed costs and contribute to net profit.
- Contribution margin is integral to product-level margin analysis, offering insights into the profitability per product, which is informative for analyzing a company's profit and growth potential, including the optimal pricing strategies.
- The formula to calculate the contribution margin is equal to revenue minus variable costs, where variable costs fluctuate with production volume, in contrast to fixed costs which remain constant irrespective of output.
- Unlike the gross margin, which is inclusive of all products and services, the contribution margin offers a more granular view of individual product profitability, which are necessary to determine the break-even point and informing decisions on pricing, discontinuation, or scaling of product lines.
How to Calculate Contribution Margin
The contribution margin (CM) is the profit generated once variable costs have been deducted from revenue.
Therefore, the contribution margin reflects how much revenue exceeds the coinciding variable costs.
While there are plenty of profitability metrics—ranging from the gross margin down to the net profit margin—the contribution margin metric stands out for the analysis of a specific product or service.
However, the contribution margin facilitates product-level margin analysis on a per-unit basis, contrary to analyzing profitability on a consolidated basis in which all products are grouped together.
In particular, the use-case of the contribution margin is most practical for companies in setting prices on their products and services appropriately to optimize their revenue growth and profitability potential.
The companies that operate near peak operating efficiency are far more likely to obtain an economic moat, contributing toward the long-term generation of sustainable profits.
If the contribution margin is too low, the current price point may need to be reconsidered. In such cases, the price of the product should be adjusted for the offering to be economically viable.
- Increased Pricing ➝ The pricing of the product line could be raised to contribute towards more profitability, as the current profit margins are unsustainable
- Discontinued ➝ The product offering could be discontinued if there is insufficient customer demand in the market after a potential price increase.
The analysis of the contribution margin facilitates a more in-depth, granular understanding of a company’s unit economics (and cost structure).
The insights derived post-analysis can determine the optimal pricing per product based on the implied incremental impact that each potential adjustment could have on its growth profile and profitability.
Given how the contribution margin analyzes the product-level breakdown of each dollar that comes in and how it contributes to generating profit, the break even point (BEP) cannot be estimated without determining the contribution margin.
Therefore, companies striving to obtain a sustainable long-term competitive advantage from the optimization of their business model must focus on identifying the products with the highest contribution margins in order to maximize potential profits.
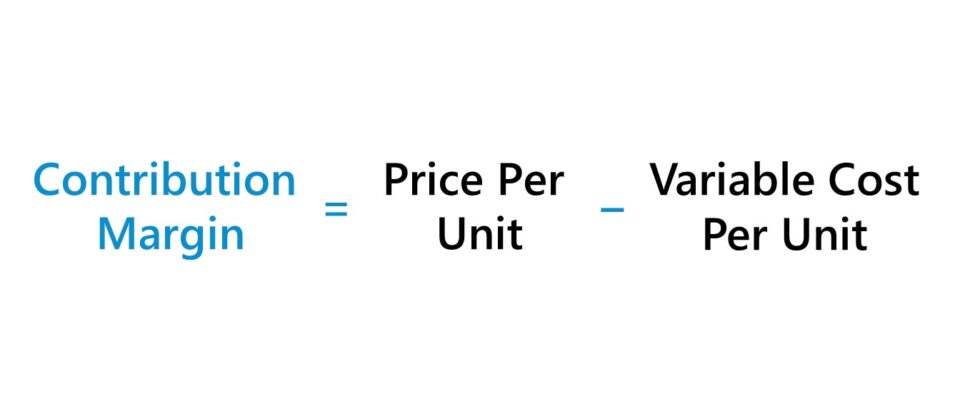
Contribution Margin Formula
The formula to calculate the contribution margin is equal to revenue minus variable costs.
Briefly, a company’s variable costs are directly associated with revenue and fluctuate based on production volume, whereas its fixed costs remain unchanged regardless of production volume.
- Variable Costs ➝ e.g. Purchase of Inventory/Materials, Direct Labor, Shipping Costs
- Fixed Costs ➝ e.g. Utilities, Rent, Insurance, Equipment
The greater the contribution margin (CM) of each product, the more profitable the company is going to be, with more cash available to meet other expenses — all else being equal.
The distinction pertains to the concept of scalability, as companies with higher variable costs tend to bring in fewer profits since the direct costs increase (and can offset) the growth in revenue, albeit the outsized expansion in profitability can reverse course in periods of underperformance.
Contribution Margin Ratio Formula
To perform a more detailed analysis on either a quarterly or year-over-year (YoY) basis—or comparisons to comparable companies operating in the same industry—the contribution margin can be divided by revenue to determine the contribution margin ratio.
For a quick example to illustrate the concept, suppose there is an e-commerce retailer selling t-shirts online for $25.00 with variable costs of $10.00 per unit.
- T-Shirt Cost = $25.00
- Variable Cost Per Unit = $10.00
The formula used to calculate the contribution margin would be as follows:
- Contribution Margin = $25.00 – $10.00 = $15.00
In the next step, the CM ratio can be calculated using the following formula:
- CM Ratio = $15.00 ÷ $25.00 = 0.60, or 60%
The 60% CM ratio implies the contribution margin for each dollar of revenue generated is $0.60.
Contribution Margin vs. Gross Margin: What is the Difference?
One common misconception pertains to the difference between the CM and the gross margin (GM).
- Gross Margin ➝ The gross margin metric—which is calculated as gross profit divided by revenue— measures the amount of revenue remaining once all direct costs (i.e. cost of goods sold, or COGS) have been subtracted.
- Contribution Margin ➝ On the other hand, the intent behind measuring the contribution margin metric shares more commonalities than differences, however, the latter can analyze profitability more in-depth on a per-unit or per-product level.
On the other hand, the gross margin metric is a profitability measure that is inclusive of all products and services offered by the company.
Contribution Margin Calculator — Excel Template
We’ll now move on to a modeling exercise, which you can access by filling out the form below.
1. Operating Assumptions
As the first step, we’ll begin by listing out the model assumptions for our simple exercise.
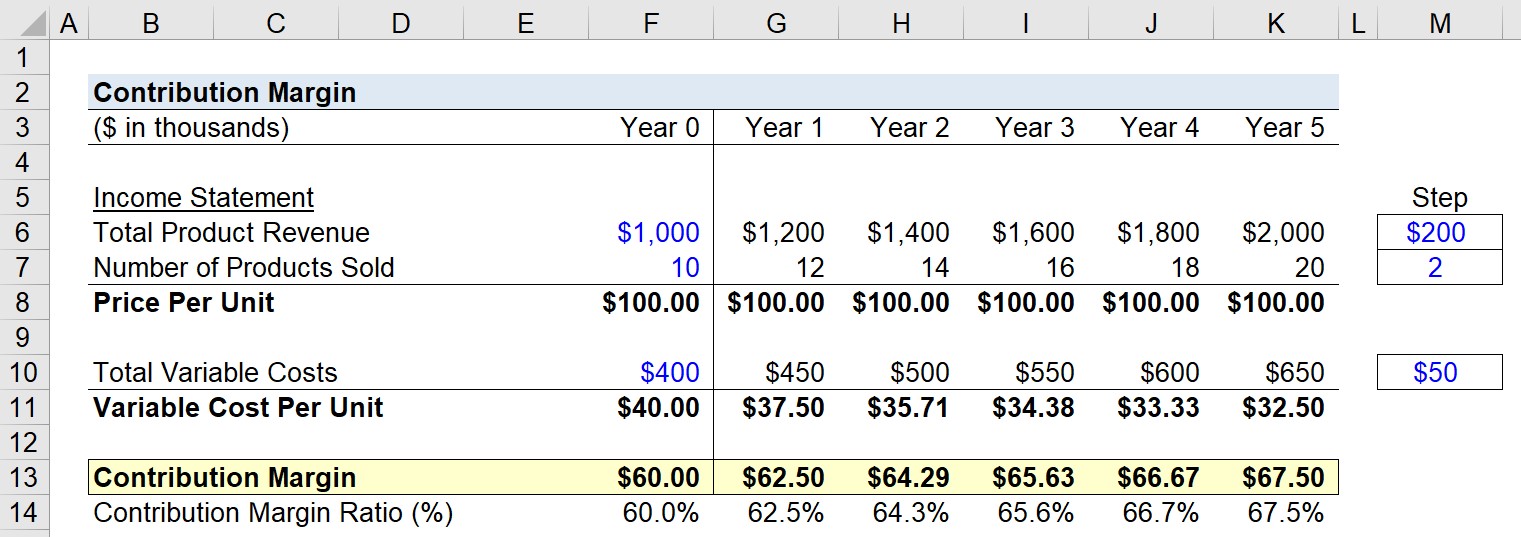
As of Year 0, the first year of our projections, our hypothetical company has the following financials.
Income Statement Data (Year 0)
- Total Product Revenue: $1 million
- Number of Products Sold: 10k
- Total Variable Costs: $400k
Using the provided data above, we can calculate the price per unit by dividing the total product revenue by the number of products sold.
- Price Per Unit = $1m ÷ 10k = $100.00
Similarly, we can then calculate the variable cost per unit by dividing the total variable costs by the number of products sold.
- Variable Cost Per Unit = $400k ÷ 10k = $40.00
For the rest of the forecast period—i.e. Year 1 and onward—we’ll assume that each line item will grow by the following figures (i.e., step function).
- Total Product Revenue: Increase by +$200k per Year
- Number of Products Sold: Increase by +2k per Year
- Total Variable Costs: Increase by +$50k per Year
If we fill out the “Price Per Unit” and “Variable Cost Per Unit” for each projected year, from Year 0 to Year 5, the figures change from:
- Price Per Unit = $100.00 (No Change)
- Variable Cost Per Unit = $40.00 → $32.50
For this section of the exercise, the key takeaway is that the CM requires matching the revenue from the sale of a specific product line, along with coinciding variable costs for that particular product.
In effect, the process can be more difficult in comparison to a quick calculation of gross profit and the gross margin using the income statement, yet is worthwhile in terms of deriving product-level insights.
2. Contribution Margin Calculation Example
We’ll next calculate the contribution margin and CM ratio in each of the projected periods in the final step.
To calculate the contribution margin, we must deduct the variable cost per unit from the price per unit.
For instance, in Year 0, we use the following formula to arrive at a contribution margin of $60.00 per unit.
- Contribution Margin = $100.00 – $40.00 = $60.00
3. Contribution Margin Ratio Calculation Example
Next, the CM ratio can be calculated by dividing the amount from the prior step by the price per unit.
In Year 0, if we divide the contribution margin by the price per unit, we can determine the CM ratio, expressed in percentage form.
- Contribution Margin Ratio (%) = $60.00 ÷ $100.00 = .60, or 60.0%
Here, we are calculating the contribution margin on a per-unit basis, but the same values would be obtained if we had used the total figures instead.
4. Contribution Margin Analysis Per Unit Example
From Year 0 to Year 5, the following changes occurred in our hypothetical scenario.
- Contribution Margin: $60.00 ➝ $67.50
- Contribution Margin Ratio (CM): 60.0% ➝ 67.5%
The overarching objective of calculating the contribution margin is to figure out how to improve operating efficiency by lowering each product’s variable costs, which collectively contributes to higher profitability.
The profitability of our company likely benefited from the increased contribution margin per product, as the contribution margin per dollar increased from $0.60 to $0.68.

Everything You Need To Master Financial Modeling
Enroll in The Premium Package: Learn Financial Statement Modeling, DCF, M&A, LBO and Comps. The same training program used at top investment banks.
Enroll Today
")


