
- What is Comparable Company Analysis?
- Comparable Company Analysis: Trading Comps Tutorial
- Quick Review of Valuation Multiples in Trading Comps Analysis
- Comparable Company Analysis Overview (Step-by-Step)
- Comparable Company Analysis: What are the Pros and Cons?
- Comps Selection Criteria: How to Select Peer Group?
- Enterprise Value vs. Equity Value Multiples: What’s the Difference?
- Comparable Company Analysis (CCA)
- 1. Select Valuation Multiples and Spread Comps in Excel
- 2. Trading Comps Analysis Example
What is Comparable Company Analysis?
Comparable Company Analysis is a relative valuation method in which a company’s value is derived from comparisons to the current stock prices of similar companies in the market.
Once the peer group of comparable companies and the appropriate valuation multiples have been established, the median or mean multiple of the peer group is applied to the corresponding metric of the target company to arrive at its comps-derived valuation.
Comparable Company Analysis: Trading Comps Tutorial
The premise of comparable company analysis is that similar companies provide an informative point of reference that can be used to derive an estimated valuation of the target company.
The implied valuation from trading comps is not meant to be a precise measure, but rather to set parameters for the target company based on the current market pricing of comparable companies.
A common analogy used to explain the concept of comps is the example of estimating the fair market value (FMV) of a home. If you researched the estimated value of nearby houses using sites such as Zillow, you’ve essentially performed a simple comps analysis.
However, the process and types of considerations become substantially more intricate when it comes to valuing companies.
Quick Review of Valuation Multiples in Trading Comps Analysis
A valuation multiple consists of a measure of value in the numerator, whereas the denominator is an operating metric.
- Numerator → Value Measure (e.g. Enterprise Value, Equity Value)
- Denominator → Value Driver (e.g. EBITDA, EBIT, Net Income, EPS)
An important rule is that the represented investor group – in other words, the capital provider(s) – must match on both the numerator and the denominator. Otherwise, the multiple cannot be used due to a mismatch in representation.
For example, enterprise value represents all the providers of capital (e.g. equity, debt) while equity value pertains only to common shareholders.
While the P/E ratio is widely recognized and used among retail investors and is also taught in academia, the most commonly used multiples in the industry are based on enterprise value, as such multiples are independent of the capital structure and focus on the core operations of the company.
Learn More → Valuation Multiple
Comparable Company Analysis Overview (Step-by-Step)
- Step 1. Compile Peer Group → The first step is to select the peer group, which will be composed of publicly traded comparable companies that are ideally competitors of the target or operate in a similar industry.
- Step 2. Industry Research → The next step is to collect applicable information from publicly available sources related to the specific target company, as well as the ongoing industry and market trends to understand the factors affecting how the market values companies in a certain industry.
- Step 3. Input Financial Data → Once an understanding of the industry is formed, the subsequent step is to collect the financial data of each comparable company, making sure to “scrub” (adjust) the financials for non-recurring items, accounting differences, leverage differences, and any cyclicality or seasonality. If the situation requires, you may also need to calendarize each company’s financials to standardize the dates (i.e. convert different ending fiscal year dates to a common timeframe).
- Step 4. Calculate Peer Group Multiples → With the financial data input, the valuation multiples can be calculated and compared against one another in the output sheet. As a general convention, the multiples are typically displayed on a last twelve months (LTM) and the next twelve months (NTM) basis, with the minimum, 25th percentile, median, mean, 75th percentile, and the maximum of each metric also calculated and summarized.
- Step 5. Apply Multiple to Target → In the final step, the median or mean multiple is applied to the target’s corresponding metric to get the comps-derived value of the target. It is important to not neglect the fundamental drivers impacting the valuation – otherwise, it’ll be difficult to defend the rationale of why a target should be valued at the lower (or higher) end of the range.
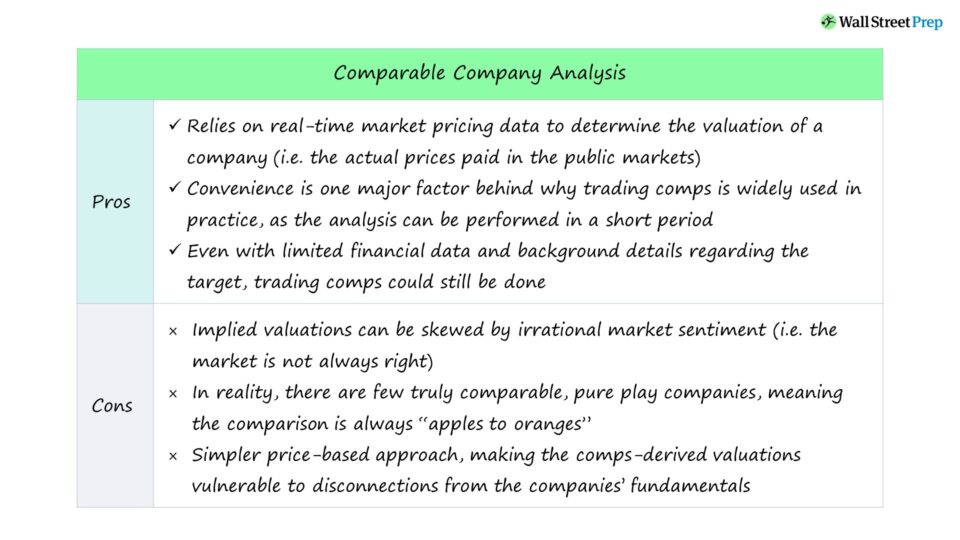
Comparable Company Analysis: What are the Pros and Cons?
The accuracy of trading comps analysis is contingent on the selection of comparable companies.
As a general rule, the more stringent the screening process for comparable companies is, the more reliable the trading comps valuation is going to be.
If comparable companies are absent in the public markets, the screening process to put together a peer group becomes less strict, which directly causes the comps valuation to lose credibility.
But while the implied valuation output from a trading comps analysis could be seen as a more realistic assessment of market pricing (and are based upon actual prices in real-time), comps are vulnerable to how the market can be wrong – and the market often does indeed misprice securities, particularly for those with smaller followings and less trading volumes.
A common misconception is that comps do not require as many assumptions as a discounted cash flow analysis (DCF). In fact, the same operating assumptions are made, but they are made implicitly rather than being explicitly chosen assumptions.
The inherent assumption behind comparable company analysis is that the market consists of rational investors.
But material disconnects between the pricing of securities and company fundamentals can still occur, which increases the importance of not relying on a single valuation method.
Given these drawbacks, trading comps should be used in conjunction with the other valuation methodologies like the DCF – as opposed to being a standalone method (i.e. “sanity check”).
Comps Selection Criteria: How to Select Peer Group?
The set of companies chosen to be compared to one another is called the “peer group”.
To maximize the accuracy of the trading comps valuation, the peer group should consist of companies that share various traits with the target company related to their business characteristics, financials (i.e. cash flow drivers), and risks.
Peer Group Selection Criteria:
- Business Characteristics: e.g. Product/Service Mix, Customer Type
- Financials: e.g. Revenue Growth, Operating and EBITDA Margins
- Risks: e.g. Changes in Regulatory Landscape, Industry Headwinds, Competitive Landscape
Under an ideal scenario, a target company is going to have an existing list of close competitors that can serve as the starting point for setting up the peer group.
For instance, if we’re compiling comparable companies for Microsoft (NASDAQ: MSFT), the peer group should consist of enterprise software companies with product offerings in relatively adjacent domains:
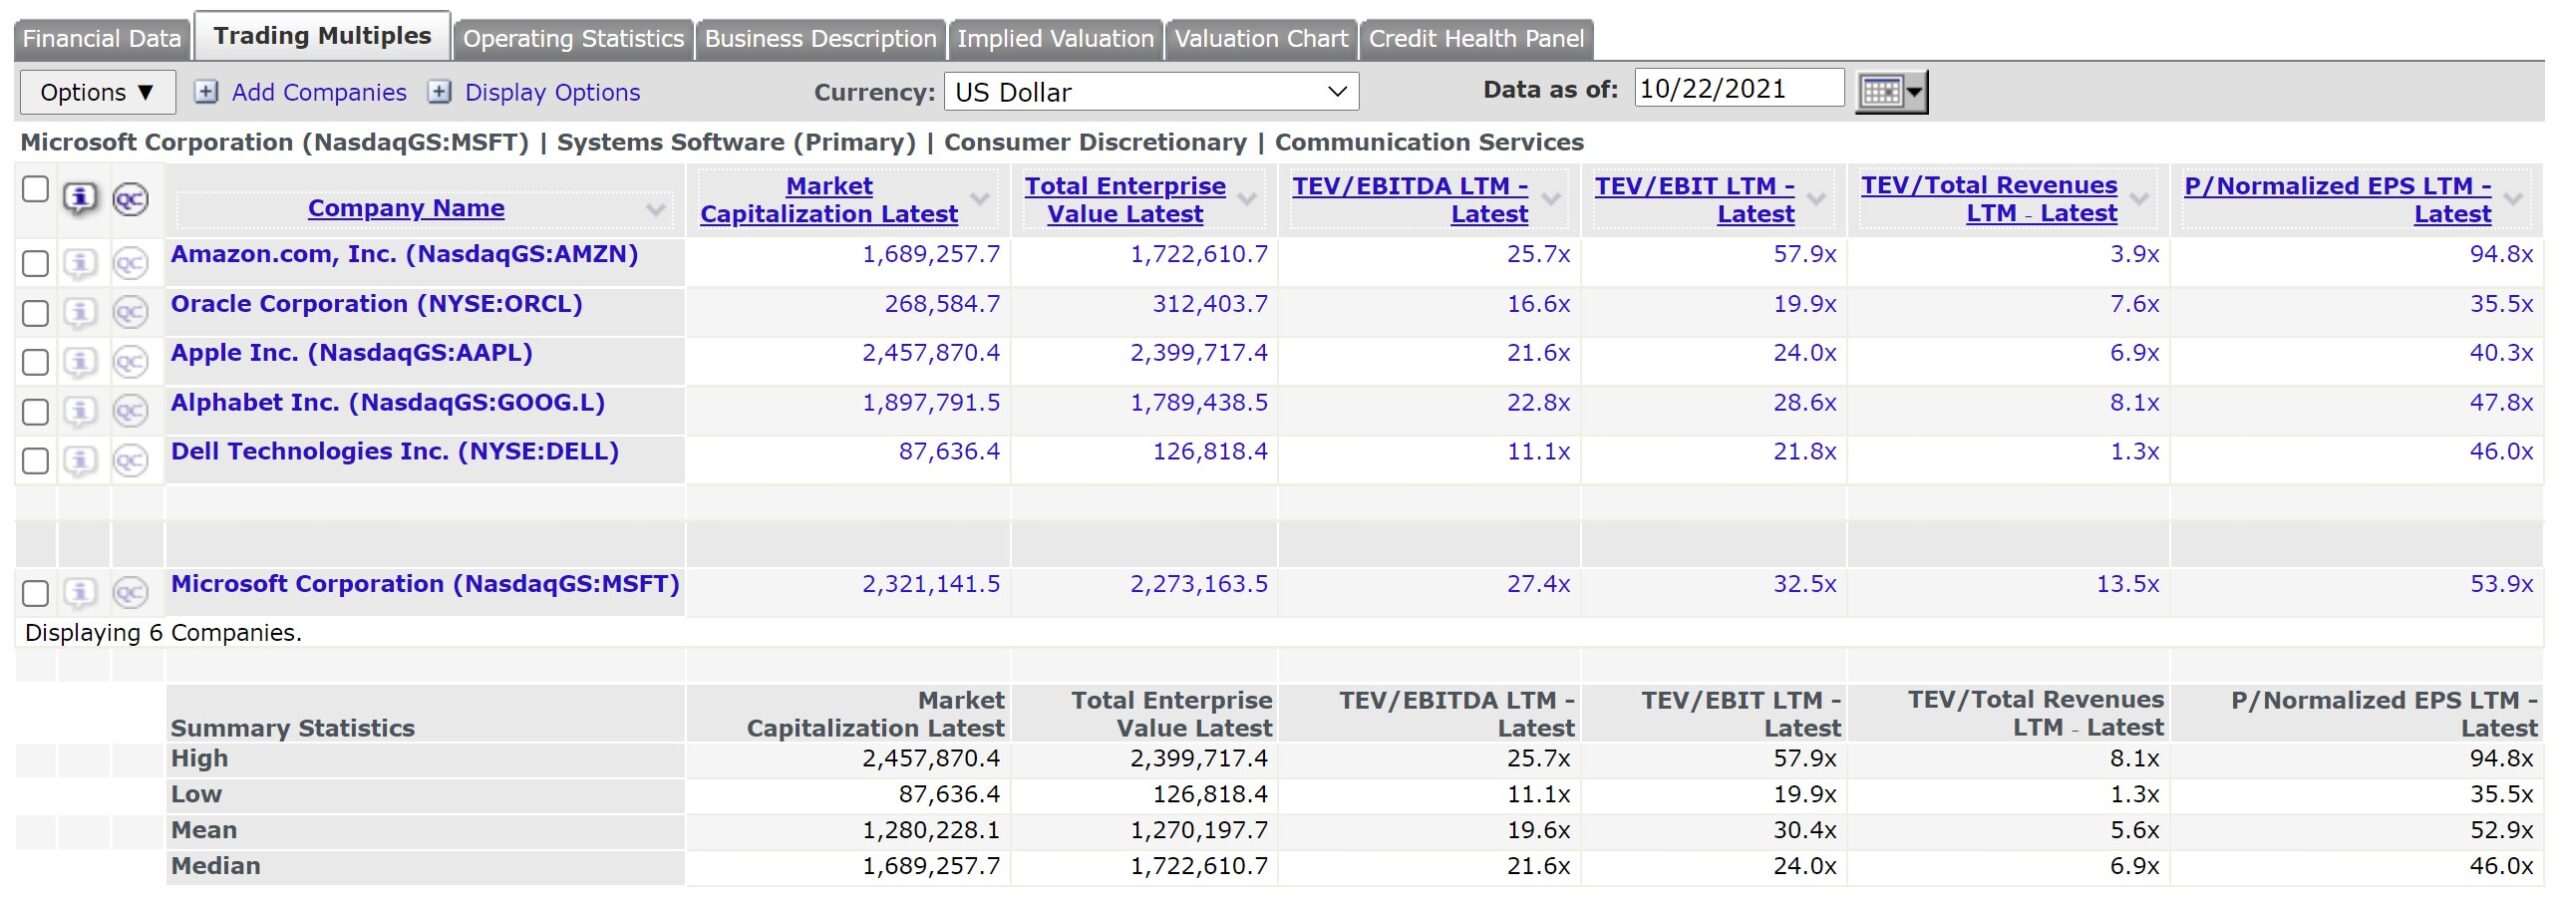
Microsoft “Quick Comps” (Source: Capital IQ)
Selecting comparable companies that are operationally alike should be the prime objective and where most of your time is spent when creating a peer group.
However, “pure-play” (exact) comparable companies are non-existent, so it’s important to remain realistic and have a certain level of flexibility when screening and choosing peers, especially if the target company operates in a niche area.
Enterprise Value vs. Equity Value Multiples: What’s the Difference?
Enterprise value and equity value, as well as operating metrics like EBITDA, cannot be compared in their absolute value forms. But upon being standardized by valuation multiples, comparisons are viable across companies of various sizes and among other differences.
Returning to our CapIQ screenshot, after the “Company Name” column, the next two columns are:
- Market Capitalization → Enterprise Value – Net Debt
- Enterprise Value (TEV) → Market Cap + Net Debt
The four columns on the right are each populated with a different valuation multiple:
- TEV/EBITDA → Enterprise Value ÷ EBITDA
- TEV/EBIT → Enterprise Value ÷ Operating Income (EBIT)
- TEV/Revenue → Revenue ÷ EBITDA
- P/E Ratio → Market Cap ÷ Net Income
Non-Recurring Items Adjustments
One frequent mistake is to neglect the step of adjusting the financials of the peer group, which is often referred to as “scrubbing” the financials.
To an extent, the financials of all companies are impacted by non-recurring income or expenses (i.e. one-time integration costs for a new acquisition, and repair costs due to a recent hurricane).
Since our objective is to compare the core operations of each company in the peer group, it’d be logical to remove the effects of these one-time line items that are NOT going to continue into the future.
Comparable Company Analysis (CCA)
We’ll now move on to a modeling exercise, which you can access by filling out the form below.
1. Select Valuation Multiples and Spread Comps in Excel
The process of “spreading comps” can be very time-consuming, with the majority of the time and effort spent on researching the target company, compiling the right comparable companies, and developing an understanding of the sector.
In comparison, building out the trading comps valuation model is rather simple. For our modeling exercise, we’ll be going through the mechanics of valuing a company using trading comps analysis, which should be straightforward because the valuation and operating assumptions are already provided (i.e. the blue hard coded numbers).
In our illustrative scenario, we’ll be working with the following financial assumptions of five different companies.
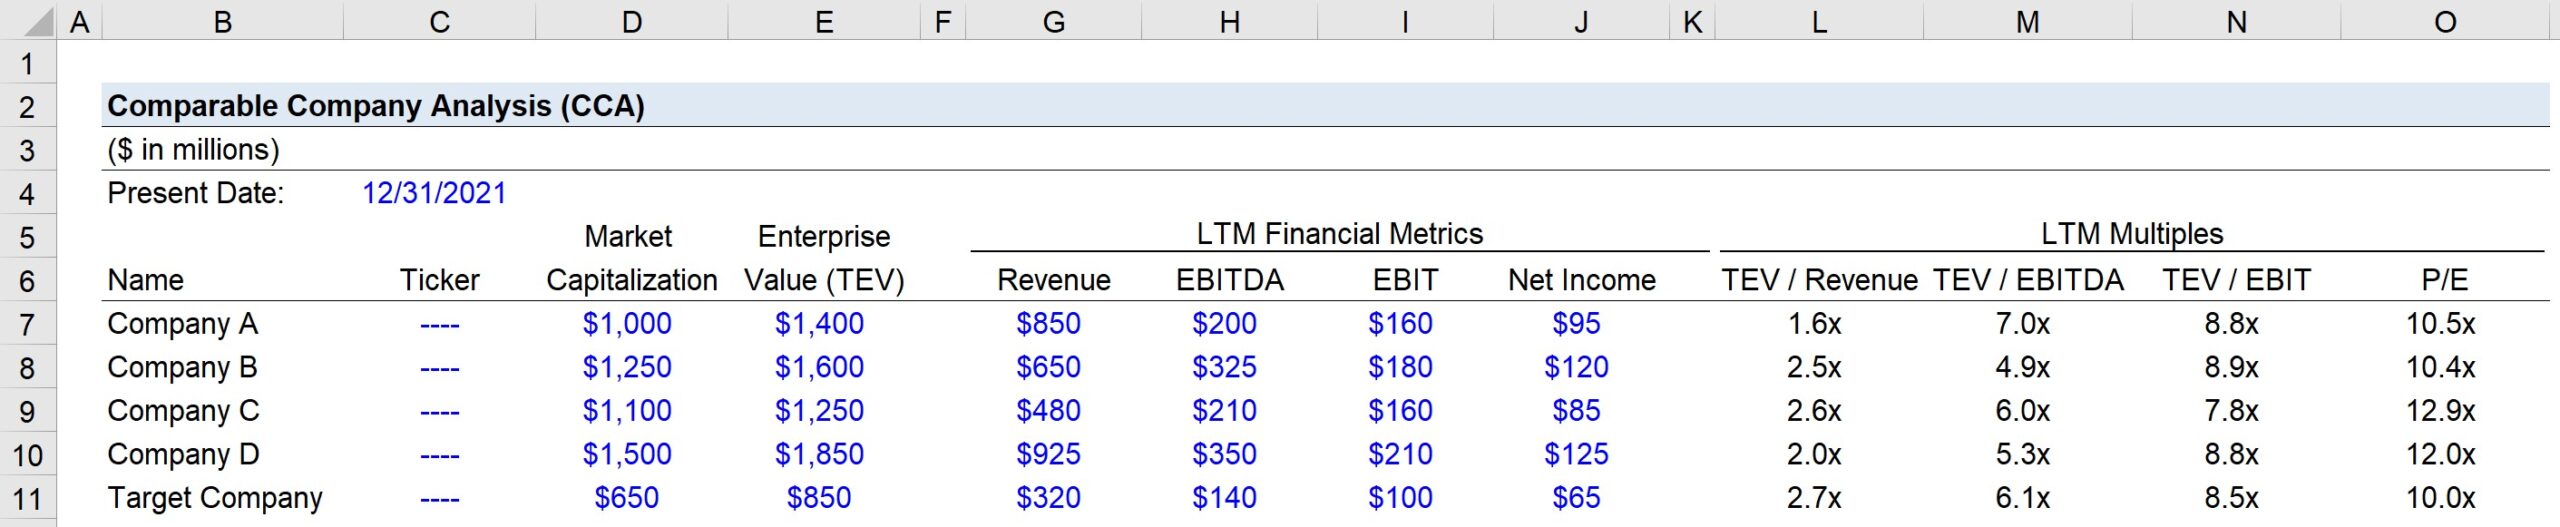
Since we’re given the valuation measures and financial metrics side-by-side, the calculation of the LTM multiples should be straightforward.
The process of calculating each valuation multiple is repeated, in which the valuation measure is divided by the corresponding operating metric of each company.
For instance, in the case of Company A’s TEV/EBITDA calculation, we divide the $1.4bn TEV by the $200m in EBITDA to get 7.0x.
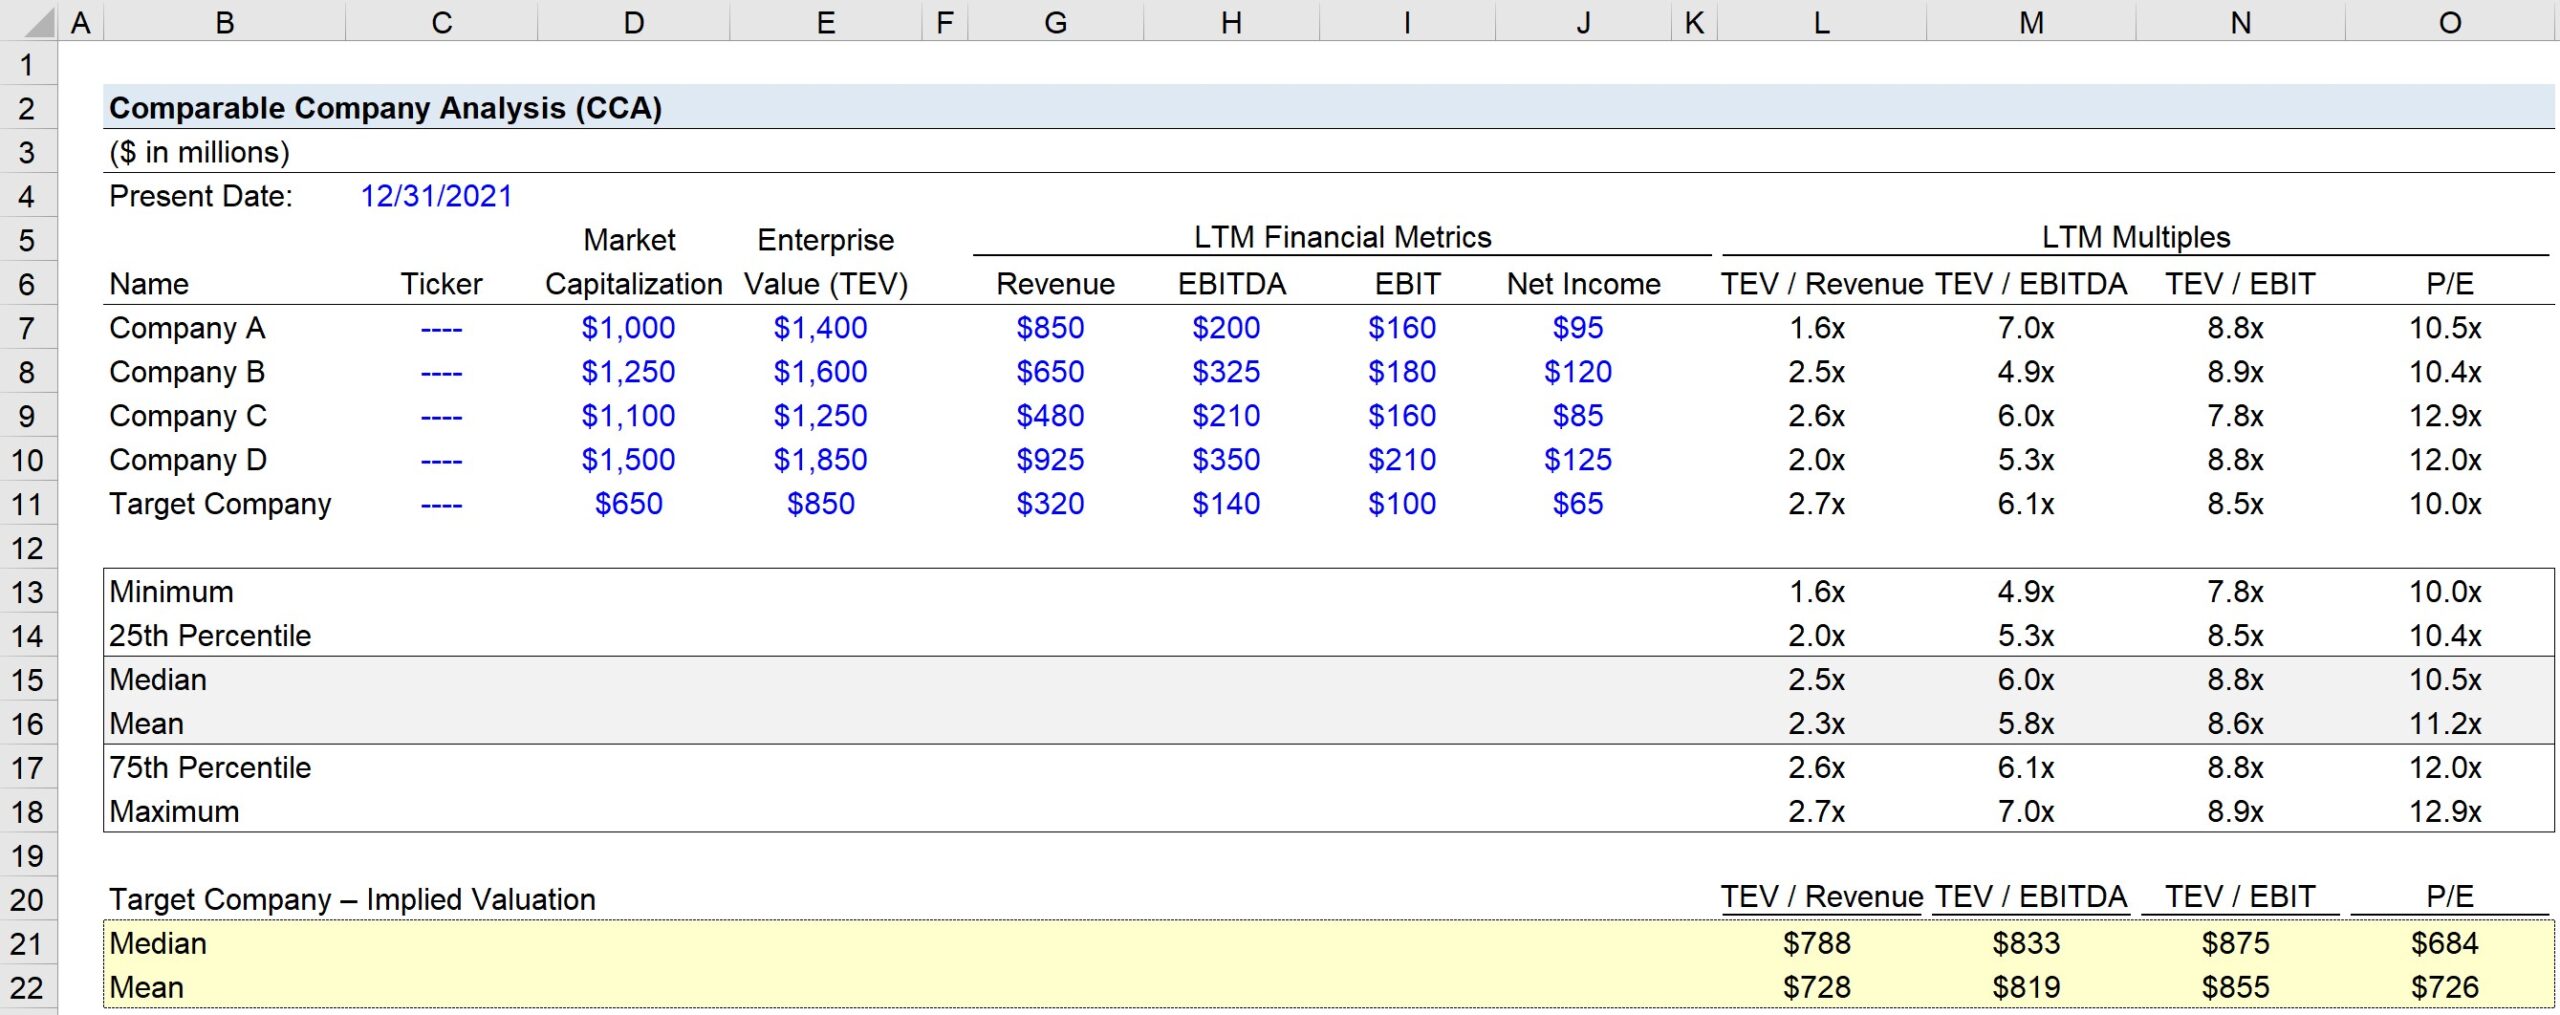
- Minimum: “=MIN(Range of Multiples)”
- 25th Percentile: “=QUARTILE(Range of Multiples,1)”
- Median: “=MEDIAN(Range of Multiples)”
- Mean: “=AVERAGE(Range of Multiples)”
- 75th Percentile: “=QUARTILE(Range of Multiples,3)”
- Maximum: “=MAX(Range of Multiples)”
The topic of whether to include or exclude the target company from the peer group is a frequent topic of debate. From one viewpoint, the inclusion of the target as part of the peer group skews the multiple towards the target’s current valuation.
However, considering the target is a part of the peer group, its exclusion from a “market-based” valuation contradicts the notion that the market is “right” on average. Of course, should a target be a private company, then it would not be (and in fact could not be) included in the calculation.
2. Trading Comps Analysis Example
In the next part of our tutorial, we’ll arrive at the valuation of the target by applying the median and mean multiples derived from the peer group of comparable companies to the metrics of the target.
Once all the appropriate valuation multiples have been calculated, the median or mean multiple can be applied to the target company to get an implied valuation.
A common question is whether the median or mean should be used.
- Median → Using the median removes the distortion caused by outliers, which increases in tandem with the number of comparable companies included.
- Mean → In contrast, the mean can be the preferable option when the peer group is comprised of only a few comparable companies (i.e. <5) with no clear outliers.
Continuing our TEV/EBITDA example, if we apply the 6.0x median TEV/EBITDA multiple to our target’s EBITDA of $140m, the implied TEV comes out to $833m.
If we determine the appropriate multiple to use in our comparable company analysis is the TEV/EBITDA multiple, the implied valuation of the target company is approximately $833m or $819m based on the peer group median and mean, respectively.

Everything You Need To Master Financial Modeling
Enroll in The Premium Package: Learn Financial Statement Modeling, DCF, M&A, LBO and Comps. The same training program used at top investment banks.
Enroll Today


Is there a place to get this information (for free), without having to go to each company’s page? I know that services like Bloomberg, Factset, etc. allow you to write formulas and automatically pull in this data, but where can I find forward revenue/EBITDA (ie. consensus), etc. without those expensive… Read more »
if you have all the financial inputs it takes less than 30 minutes, Usually easier for public companies , since the data is available. But you might need some time to scrub the financials
How many hours does it take to spread ONE trading multiple (EV/EBITDA), using filings, from scratch? I am asking this question since I need to do scoping of work at office. Awaiting your kind reply ..