
- What is Capital Structure?
- How Does the Capital Structure Work?
- What are the Full–Form Capital Structure Components?
- How to Analyze Capital Structure (Debt-Equity Mix)
- Capital Structure Formula
- What Factors Affect Capital Structure?
- How to Optimize Capital Structure (Debt–Equity Ratio)
- Why Does the Capital Structure Matter?
- Capital Structure Calculator
- 1. Capitalization Assumptions
- 2. Capital Structure Example (All-Equity Firm)
- 3. Capital Structure Example (50/50 Debt to Equity Firm)
What is Capital Structure?
The Capital Structure is the mixture of debt, preferred stock, and common equity used by a company to fund its operations and purchase assets.
Often referred to as the “capitalization”, the capital structure of a company is determined by management’s discretionary decisions pertaining to how to fund operations and the purchase of fixed assets, or capital expenditures (Capex).
- The capital structure refers to the percentage of common equity, preferred stock, and debt utilized by a corporation to finance its operating activities and acquire fixed assets (PP&E).
- The formula to calculate a company’s capital structure is: Common Equity Weight (%) + Debt Weight (%) + Preferred Stock Weight (%)
- In theory, the optimal capital structure balances the trade-off between the benefits of debt (“interest tax shield”) and the risk of insolvency, i.e. financial distress.
- The weighted average cost of capital (WACC) is minimized, while the implied firm valuation is maximized at the optimal capital structure.
How Does the Capital Structure Work?
The capital structure is the allocation of debt, preferred stock, and common stock by a company used to finance working capital needs and acquire fixed assets (PP&E).
In short, the capital structure is the mixture of debt and equity that firms utilize to finance their near-term and long-term growth strategies.
For most companies that reach a certain size, raising outside capital is frequently a necessity to reach the next stage of growth and to continue their efforts to expand their operations.
Using the proceeds from debt and equity issuances, a company can finance operations, day-to-day working capital needs, capital expenditures (Capex), business acquisitions, and more.
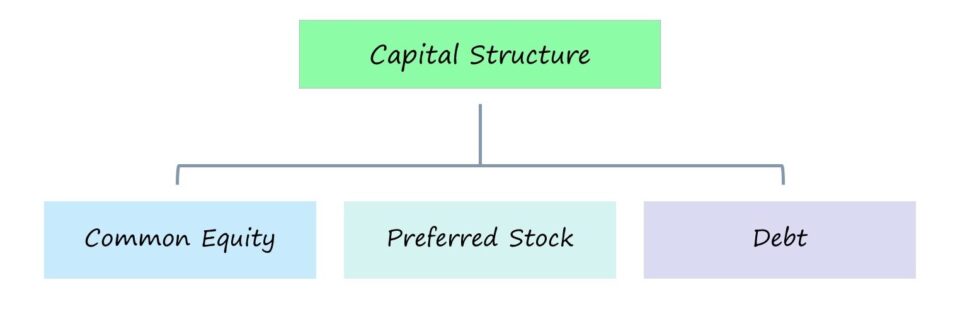
What are the Full–Form Capital Structure Components?
Corporations can choose to raise outside capital in the form of either debt or equity.
- Debt → The capital borrowed from creditors as part of a contractual agreement, where the borrower agrees to pay interest and return the original principal on the date of maturity.
- Common Equity → The capital provided from investors in the company in exchange for partial ownership in future earnings and assets of the company.
- Preferred Stock → The capital provided by investors with priority over common equity but lower priority than all debt instruments, with features that blend debt and equity (i.e. “hybrid” securities).
How to Analyze Capital Structure (Debt-Equity Mix)
Debt financing is generally perceived as a “cheaper” source of financing than equity, which can be attributed to taxes, among other factors. Unlike dividends, interest payments are tax-deductible, creating a so-called “interest tax shield” as a company’s taxable income (and the amount of taxes due) is lowered.
By opting to raise debt capital, existing shareholders’ control of the firm’s ownership is also protected, unless there is the option for the debt to be converted into equity (i.e. convertible debt).
The lower the percentage of total funding contributed by equity investors, the more credit risk that the lenders must bear – all else being equal.
If the return on investment (ROI) on the debt offsets (and earns more) than the cost of interest and principal repayment, then the company’s decision to risk the shareholders’ equity paid off.
The downside to debt, however, is the required interest expense on loans and bonds, as well as mandatory amortization payments on loans. The latter is far more common for senior debt lenders such as corporate banks, as these risk-averse lenders prioritizing capital preservation are likely to include such provisions in the agreement.
Senior debt is often called senior secured debt, as there can be covenants attached to the loan agreement – albeit restrictive covenants are no longer the norm in the current credit environment.
Capital Structure Formula
The formula to determine a company’s capital structure, expressed in percentage form, is as follows.
Where:
- Common Equity Weight (%) = Common Equity ÷ Total Capitalization
- Debt Weight (%) = Total Debt ÷ Total Capitalization
- Preferred Stock Weight (%) = Preferred Stock ÷ Total Capitalization
Combined, the resulting percentage contribution per capital source must equal 1.0, or 100%.
What Factors Affect Capital Structure?
Early-stage companies rarely carry any debt on their balance sheet, as finding an interested lender is challenging given their risk profiles.
In contrast, if a borrower is a mature, established company with a track record of historical profitability and low cyclicality, lenders are far more likely to negotiate with them and offer favorable lending terms.
Consequently, a company’s stage in its life cycle, along with its cash flow profile to support the debt on its balance sheet, dictates the most suitable capital structure.
Established, mature companies are able to obtain debt at cheaper pricing rates, contrary to early-stage companies.
The corporate borrower must repay the remaining principal in full at the end of the debt’s maturity – in addition to the interest expense payments during the life of the loan.
The maturity date stated on a lending agreement illustrates how debt represents a finite financing source, unlike common equity, which is perpetual in theory.
If the company fails to repay the principal at maturity, the borrower is now in technical default because it has breached the contractual obligation to repay the lender on time.
Hence, companies with highly leveraged capital structures relative to their free cash flow profile (FCFs) can reasonably handle frequently end up becoming insolvent and filing for bankruptcy.
In such cases, the unsustainable capital structure makes financial restructuring necessary, where the debtor attempts to “right-size” its balance sheet by reducing the debt burden – as negotiated with creditors either out-of-court or in-court.
How to Optimize Capital Structure (Debt–Equity Ratio)
Most companies seek an “optimal” capital structure, in which the total valuation of the company is maximized while the cost of capital is minimized.
With that said, the objective of most companies is to balance the trade-offs among the benefits of debt (e.g. reduced taxes) and the risk of taking on too much leverage.
The required rate of return, or the cost of capital, is the minimum rate of return a company must earn to meet the hurdle rate of return demanded by the capital providers.
The cost of capital accounts for the weight of each funding source in the company’s total capitalization (and each component’s separate costs).
- Debt ➝ Cost of Debt (kd)
- Common Equity ➝ Cost of Equity (ke)
- Preferred Stock ➝ Cost of Preferred Stock (kp)
The expected future cash flows must be discounted using the proper discount rate – i.e. the cost of capital – for each source of capital.
In effect, the lower the cost of capital (i.e. the “blended” discount rate), the greater the present value (PV) of the firm’s future free cash flows will be.
Leverage ratios can measure a company’s level of reliance on debt to finance assets and determine if the operating cash flows of the company generated by its asset base are sufficient to service interest expense and other financial obligations.
- Debt to Assets Ratio = Total Debt ÷ Total Assets
- Debt to Equity Ratio (D/E) = Total Debt ÷ Total Equity
- Times Interest Earned (TIE) Ratio = EBIT ÷ Fixed Charges
- Fixed Charge Coverage Ratio = (EBIT + Leases) ÷ (Interest Expense Charges + Leases)
Why Does the Capital Structure Matter?
If debt begins to comprise a greater proportion of the capital structure, the weighted average cost of capital (WACC) initially declines due to the tax-deductibility of interest (i.e. the “interest tax shield”).
The cost of debt is lower than the cost of equity because of interest expense – i.e. the cost of borrowing debt – is tax-deductible, whereas dividends to shareholders are not.
The WACC continues to decrease until the optimal capital structure is reached, where the WACC is the lowest (and at this point, the firm is at “peak valuation”).
Beyond this threshold, the potential for financial distress offsets the tax benefits of leverage, causing the risk to all company stakeholders to rise.
Thus, debt issuances impact not only the cost of debt but also the cost of equity because the company’s credit risk increases as the debt burden increases – which is particularly concerning for equity holders, who are placed at the bottom of the capital structure.
Common equity represents the lowest priority claim under a liquidation scenario (and are the least likely to recover funds in the case of bankruptcy).
While shareholders are partial owners of the company, on paper, management has no obligation to issue them dividends, so share price appreciation can often be the only source of income.
However, the share price (and capital gain) upside belongs entirely to equity holders, whereas lenders receive only a fixed amount via interest and principal amortization.
Capital Structure Calculator
We’ll now move to a modeling exercise, which you can access by filling out the form below.
1. Capitalization Assumptions
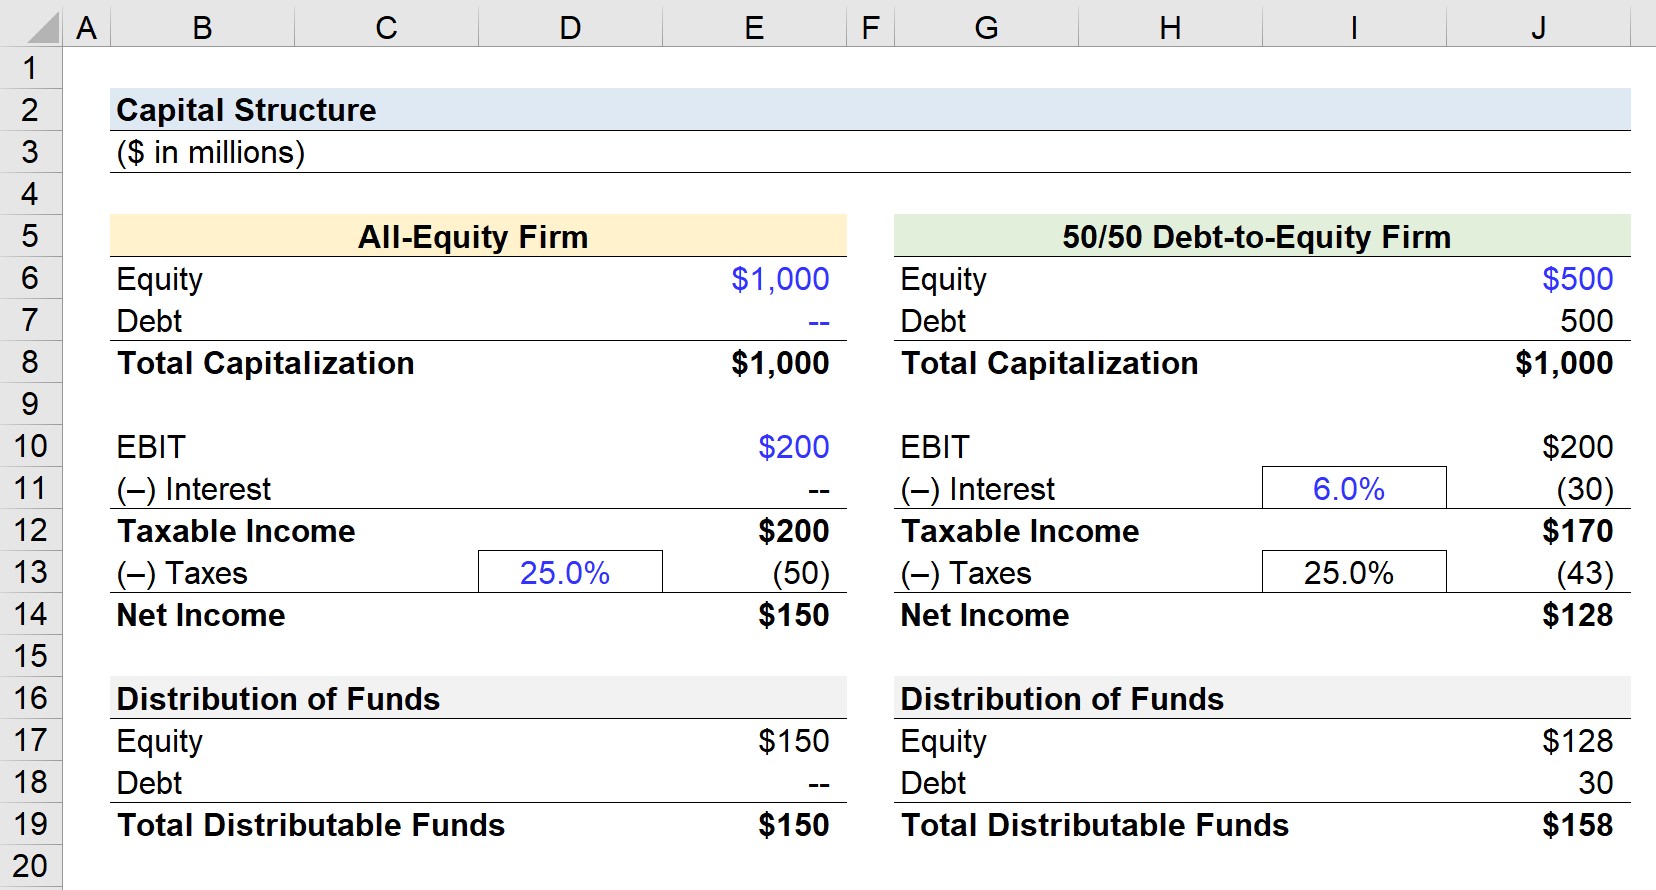
In our illustrative training tutorial in Excel, we’ll compare the same company under two different capital structures.
The company’s total capitalization in both cases is $1 billion, but the major distinction is where the funding came from.
- Scenario A → All-Equity Firm (No Debt)
- Scenario B → 50/50 Debt-to-Equity Firm
2. Capital Structure Example (All-Equity Firm)
In Scenario A, the company is funded entirely by equity, whereas in the second scenario, the company’s funding is split equally between equity and debt.
We’ll assume the company’s EBIT is $200 million in both cases, the interest rate on debt is 6%, and the applicable tax rate is 25%.
- Operating Income (EBIT) = $200 million
- Interest Rate (%) = 6.0%
- Tax Rate (%) = 25.0%
The taxable income is equivalent to EBIT for the all-equity firm, since there is no tax-deductible interest.
Therefore, the tax expense is $50 million, which results in net income of $150 million.
Since there are no required payments to debt holders, all the net income could hypothetically be distributed to equity holders as dividends, share buybacks, or kept in retained earnings to reinvest in the company’s operations.
3. Capital Structure Example (50/50 Debt to Equity Firm)
Next, for our company with the 50/50 capital structure, the interest expense comes out to $30 million, which directly reduces taxable income.
Given the 25% tax rate, the tax incurred is $7 million less than in the all-equity scenario, representing the interest tax shield.
In the final step, we can see that net income is lower for the company under the capital structure with debt.
Yet, the total distribution of funds is $8 million higher for the company with debt than the all-equity company because of the additional amount that flowed to debt holders rather than being taxed.
The capital structure should be adjusted to meet a company’s near-term and long-term objectives.
Therefore, the optimal capital structure fluctuates depending on a company’s life-cycle, free cash flow profile (FCF), and prevailing market conditions.

Everything You Need To Master Financial Modeling
Enroll in The Premium Package: Learn Financial Statement Modeling, DCF, M&A, LBO and Comps. The same training program used at top investment banks.
Enroll Today


