
- What is the Capital Intensity Ratio?
- How to Calculate Capital Intensity Ratio
- What is a Good Capital Intensity Ratio?
- Capital Intensity Ratio Formula
- Capital Intensity Ratio Calculator
- Capital Intensity Ratio Calculation Example
- Capital Intensity Ratio vs. Asset Turnover: What is the Difference?
- How to Analyze Capital Intensity by Industry
- What are Examples of High vs. Low Capital Intensity Sectors?
- Can Capital Intensity Function as a Barrier to Entry?
What is the Capital Intensity Ratio?
The Capital Intensity Ratio is a method to measure the reliance on asset purchases by a company to sustain a specified level of growth.
How to Calculate Capital Intensity Ratio
Capital-intensive industries are characterized by substantial spending requirements on fixed assets relative to total revenue.
If a company is described as “capital intensive,” its growth is implied to require substantial capital investments, while “non-capital-intensive” companies require less spending to create the same amount of revenue.
Capital intensity measures the amount of spending on assets necessary to support a certain level of revenue.
To illustrate the concept in the form of a question, “How much capital is needed to generate $1.00 of revenue?”
Common examples of capital assets can be found below:
- Equipment
- Property
- Buildings
- Land
- Heavy Machinery
- Vehicles
Companies with significant fixed asset purchases are considered more capital intensive, i.e. requiring consistently high capital expenditures (Capex) as a percentage of revenue.
What is a Good Capital Intensity Ratio?
Capital intensity is a key driver of corporate valuation, because numerous variables are impacted, namely capital expenditures (Capex), depreciation, and net working capital (NWC).
Capex is the purchase of long-term fixed assets, i.e. property, plant & equipment (PP&E), while depreciation is the allocation of the expenditure across the useful life assumption of the fixed asset.
Net working capital (NWC), the other type of reinvestment besides Capex, determines the amount of cash tied up in day-to-day operations.
- Positive Change in NWC → Less Free Cash Flow (FCF)
- Negative Change in NWC → More Free Cash Flow (FCF)
Why? An increase in an operating NWC asset (e.g. accounts receivable, inventories) and a decrease in an operating NWC liability (e.g. accounts payable, accrued expenses) reduce free cash flows (FCFs).
On the other hand, a decrease in an operating NWC asset and an increase in an operating NWC liability causes free cash flows (FCFs) to rise.
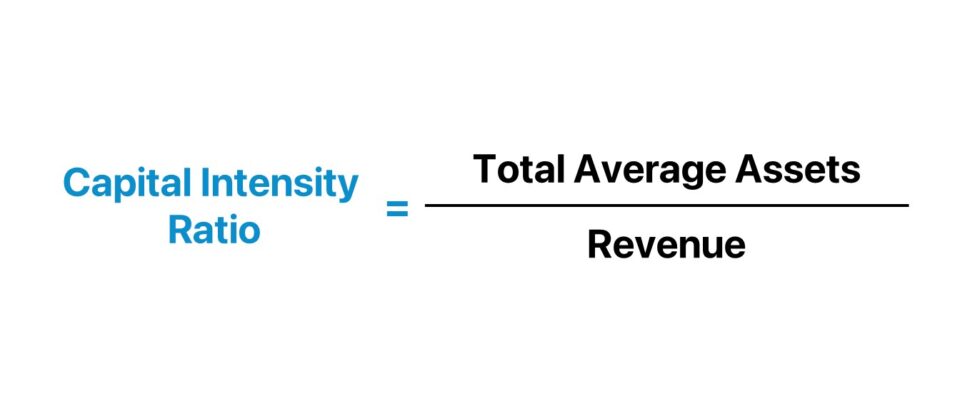
Capital Intensity Ratio Formula
One method to gauge a company’s capital intensity is called the “capital intensity ratio.”
Simply put, the capital intensity ratio is the amount of spending required per dollar of revenue generated.
The formula for calculating the capital intensity ratio consists of dividing the average total assets of a company by its revenue in the corresponding period.
The Wharton Online & Wall Street Prep Applied Value Investing Certificate Program
Learn how institutional investors identify high-potential undervalued stocks. Enrollment is open for the Feb. 10 - Apr. 6 cohort.
Enroll TodayCapital Intensity Ratio Calculator
We’ll now move to a modeling exercise, which you can access by filling out the form below.
Capital Intensity Ratio Calculation Example
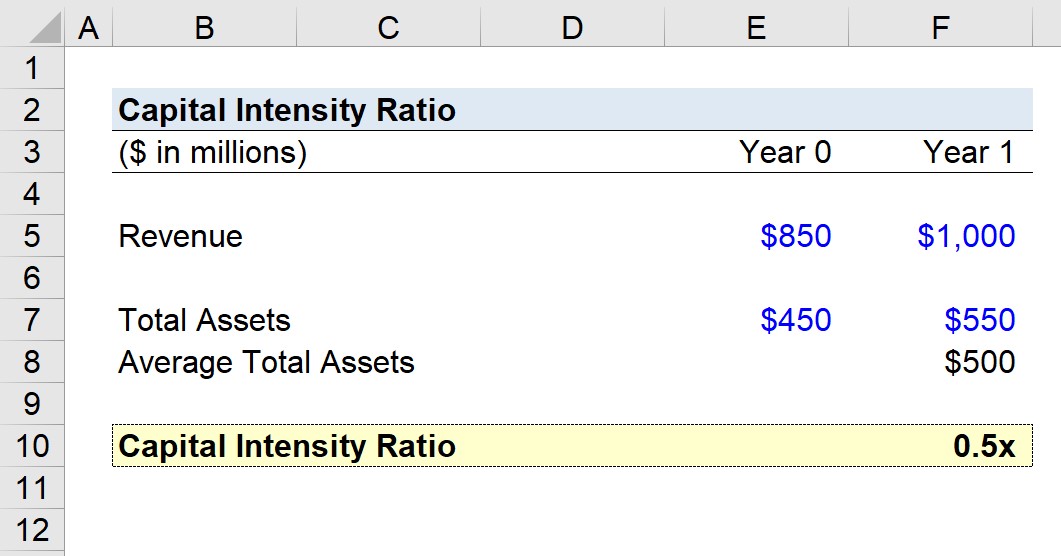
Suppose a company has $1 million in revenue during Year 1.
If the company’s total asset balance was $450,000 in Year 0 and $550,000 in Year 1, the average assets balance is $500,000.
From the equation below, we can see that the capital intensity ratio is 0.5x.
- Capital Intensity Ratio = $500,000 ÷ $1 million = 0.5x
The 0.5x capital intensity ratio implies the company spent $0.50 to generate $1.00 of revenue.
Capital Intensity Ratio vs. Asset Turnover: What is the Difference?
The capital intensity ratio and asset turnover are closely related tools for gauging how efficiently a company can utilize its asset base.
The capital intensity ratio and total asset turnover can be calculated using only two variables:
- Total Assets
- Revenue
The total asset turnover measures the amount of revenue generated per dollar of assets owned.
The formula for calculating the total asset turnover is the annual revenue divided by the average total assets (i.e. sum of the beginning of period and end of period balance, divided by two).
Generally, a higher asset turnover is preferred, as it implies more revenue is generated for each dollar of an asset.
If we use the same assumptions as our earlier example, the total asset turnover is 2.0x, i.e. the company generates $2.00 in revenue for each $1.00 in assets.
- Total Asset Turnover = $1 million ÷ $500,000 = 2.0x
While you likely noticed by now, the capital intensity ratio and total asset turnover ratio are reciprocals.
Therefore, the capital intensity ratio is equal to one divided by the total asset turnover ratio.
While a higher figure is preferred for the total asset turnover, a lower figure is better for the capital intensity ratio, since less capital spending is needed.
How to Analyze Capital Intensity by Industry
If a company is considered capital intensive, i.e. a high capital intensive ratio, the company must spend more on purchasing physical assets (and periodic maintenance or replacements).
In contrast, a non-capital-intensive company spends relatively less for its operations to continue to generate revenue.
All else being equal, companies with higher capital intensity ratios relative to industry peers are more likely to have lower profit margins from greater spending.
Labor costs are typically the most significant cash outflow for non-capital intensive industries, rather than Capex.
Another method to estimate a company’s capital intensity is to divide Capex by the total labor costs.
There is no set rule on whether a high or lower capital intensity ratio is better, as the answer depends on the circumstantial details.
For example, a company with a high capital intensity ratio could suffer from low-profit margins, which are the result of inefficient utilization of its asset base — or the general line of business and industry could just be more capital intensive.
Hence, comparing the capital intensity ratio of different companies should only be done if the peer companies operate in the same (or similar) industry.
If so, companies with a lower capital intensity ratio are likely more profitable with more free cash flow (FCF) generation, since more revenue can be generated with fewer assets.
But to reiterate, an in-depth evaluation of the companies’ unit economics is necessary to confirm if the company is, in fact, more efficient.
What are Examples of High vs. Low Capital Intensity Sectors?
The chart below provides examples of capital-intensive and non-capital-intensive industries.
| High Capital Intensity | Low Capital Intensity |
|---|---|
|
|
|
|
|
|
|
|
|
|
|
|
The clear pattern is that for high capital intensity industries, the effective utilization of fixed assets drives revenue generation.
However, for low capital intensity industries, fixed asset purchases are substantially lower than the total labor costs.
Can Capital Intensity Function as a Barrier to Entry?
Capital intensity is often associated with low-profit margins and large cash outflows related to Capex.
Asset-light industries can be preferable, given the reduced capital spending requirements to sustain and increase revenue growth.
Yet, capital intensity can be a barrier to entry, which deters entrants, and stabilizes their cash flows, as well as their current market share (and profit margins).
From the perspective of new entrants, a significant initial investment is necessary to even begin to compete in the market.
Considering the limited number of companies in the market, incumbents possess more pricing power over their customer base (and can fend off competition by offering lower prices that unprofitable companies cannot match).


