
What is Basic EPS?
The Basic EPS is a profitability ratio used to measure the residual net income allocatable to common shareholders on a per-share basis.
Since the basic EPS metric is expressed on a standardized basis, the net earnings of companies can be compared and analyzed – albeit there are shortcomings to be aware of regarding the accounting metric.

How to Calculate Basic EPS?
The basic earnings per share (EPS) metric refers to the total amount of net income that a company generates for each common share outstanding.
The basic EPS is calculated by dividing a company’s net income by the weighted average of common shares outstanding.
Equity holders have the potential to obtain greater returns relative to debt and other forms of capital, because they must receive more compensation for taking on this increased risk – or said differently, higher risks should equate to higher potential returns.
However, if the company has preferred dividends, we must subtract the value of the dividends paid out to preferred shareholders, because preferred dividends are treated “debt-like.”
- Preferred Shareholders → Preferred shareholders, as implied by the name, take precedence over common shareholders. Any payments made to them, similar to interest payments to lenders, must be deducted from the residual profit remaining for common shareholders.
- Common Shareholders → While common shareholders have the greatest upside potential, in return, this group of capital providers is placed at the very bottom of the capital structure (i.e. lowest priority).
Basic EPS Formula
To reiterate, the formula for calculating basic EPS involves dividing net income by the weighted average number of common shares outstanding.
If you were wondering why the formula uses the weighted average of common shares outstanding – rather than the beginning or end of period balance – that is a compromise to fix the timing mismatch between the numerator and denominator.
The income statement, i.e. the source of net income, captures a period of time across two specified periods, whereas the share count data is based on a specific ending date (i.e. the balance sheet or the beginning section of 10-K/10-Q).
Thus, we use the weighted average common shares to account for this time difference.
Basic EPS Calculator
We’ll now move on to a modeling exercise, which you can access by filling out the form below.
1. Income Statement Assumptions
First, we’ll begin by briefly explaining the operating assumptions used to calculate basic EPS.
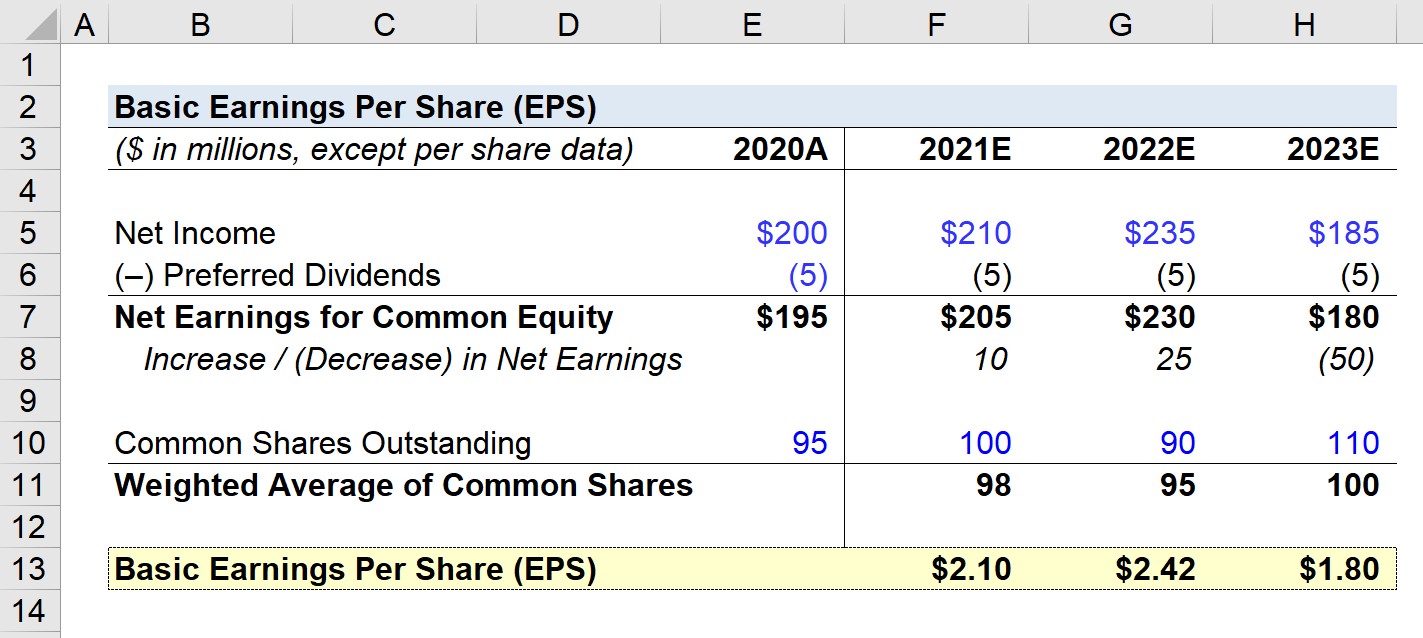
As of 2020, the company’s latest fiscal year has the following financial data:
- Net Income = $200mm
- Preferred Dividends = $5mm
With those two assumptions stated, we can calculate the “Net Earnings for Common Equity” – which is the portion of net income attributable to just common shareholders – by subtracting the preferred dividends from net income.
So in 2020, net earnings for common equity holders comes out to $195mm.
- Net Earnings for Common Equity = $200mm Net Income – $5mm Preferred Dividends = $195mm
Next, for the subsequent section, we must calculate the weighted average common shares outstanding for each period.
2. Basic Earnings Per Share Calculation Example
In Excel, the steps to calculate the basic EPS for each year are:
- Link to Net Earnings in the Applicable Period
- Divide by the Average Between the Current Period and Prior Period Common Shares Outstanding
Just as an example, the formula for the basic EPS in 2020A is listed below:
- Basic Earnings per Share (EPS), 2021E = $205mm Net Earnings to Common ÷ AVERAGE (95mm, 100mm Common Shares)
- Basic EPS, 2021E = $2.10
As for the rest of the forecast, we’ll be using various assumptions to show various operating scenarios and the net impact on basic EPS.
To start working through the projection period, we’ll begin with the net income assumptions:
- 2021 → Net Income Increased by $10mm YoY
- 2022 → Net Income Increased by $25mm YoY
- 2023 → Net Income Decreased by $50mm YoY
In terms of our assumptions for preferred dividends, we’ll keep the amount fixed at $5mm each year. But the impact on basic EPS should be rather intuitive – i.e. increased preferred dividends causes lower EPS (and vice versa).
Then, our assumptions for the common shares outstanding can be found here:
- 2021 → Common Shares Decreased by 5mm YoY
- 2022 → Common Shares Decreased by 10mm YoY
- 2023 → Common Shares Increased by 20mm YoY
3. Basic EPS Ratio Analysis Example
Provided with our simplistic assumptions, the pattern should be clear that in years when net income increases, common shares decline (i.e. share repurchases), while the number of common shares increases when net income falls (i.e. mandatory capital raises).
Therefore, our baseline basic EPS figure following moderately positive performance is $2.10 in 2021.
In comparison, after another year of strong performance, basic EPS is $2.42 as a result of the growth of $25mm in net income and a reduction of 10mm shares.
But in contrast, during the year depicting underwhelming performance, basic EPS contracts to $1.80 following a year of poor performance in which net earnings fell $50mm with the common share count expanding by 20mm shares.
The net impact that changes in a company’s net income and the number of common shares have on basic earnings per share (EPS) for a given period can be observed from our modeling exercise.
What is a Good Basic Earnings Per Share?
As a general rule, higher basic EPS values signal greater firm value as in these cases, the market will tend to be willing to pay a premium for each share of a company’s equity.
Let’s say that a company has consistently produced higher EPS figures compared to comparable companies in the same (or adjacent) sector.
Assuming that enough side diligence was conducted, the vast majority of rational investors are willing to pay a higher price for companies with a solid track record of consistent profitability.
A high EPS, in favorable instances, can stem from any of the following causes:
- Sustainable Competitive Advantage (i.e. “Economic Moat”)
- Market Leadership (i.e. High Market Share, Pricing Power)
- Strong, Competent Management Team
- Loyal, Recurring Customer Base – Potentially Significant % of Contractual Revenue
All else being equal, the market tends to be willing to pay more for companies with higher net profits.
One caveat, however, is that high-growth companies with minimal profits at the “bottom line” can still obtain high valuations from the market.
The reasoning is that the market is forward-looking, and therefore paying for the *potential* improved profitability in the coming years once the company matures (i.e. projected EPS).
While the company may be struggling to remain profitable or may even be unprofitable, investors can attach high valuations for such companies on the notion that the company will become profitable someday – but for the time being, “top-line” revenue growth is often the single-minded objective shared between the early-stage company and its investor base.
But in the case of mature industries in which low EPS figures are considered the norm, any companies with negative profitability are unlikely to receive favorable valuations.
For companies in the later stages of their maturity cycle, lower profit margins tend to coincide with reduced free cash flows (FCFs) as well as fewer growth opportunities, which collectively result in lower valuations.
How to Interpret Basic EPS Ratio?
Note that in the calculation of basic earnings per share (EPS), the share count used accounts only for the number of straightforward common shares.
As such, basic EPS neglects the potentially dilutive impact associated with the issuance of dilutive securities (i.e. options, warrants).
For instance, if you own a company and decide to compensate employees with stock-based compensation via options and warrants, those contracts increase the share count once executed or the vesting period has passed.
Common examples of potentially dilutive securities to be weary of are the following:
- Options
- Warrants
- Restricted Stock Units (RSUs)
- Convertible Debt Securities
- Preferred Stock with Conversion Feature
If these securities are “in-the-money”, which means that these financial contracts are profitable to execute (i.e. with a monetary incentive), the total share count should factor in the net impact of these securities.
Otherwise, there is the risk that the EPS figure will be inflated by ignoring the potentially dilutive impacts of such issued securities, which can cause the metric to be misleading (and possibly overstated).
Another consideration is that in practice, it has gradually become the norm to account for securities even if they are “out-of-the-money” based on the premise that they’ll turn profitable (and be dilutive to existing equity holders) someday – just on a later date.

Everything You Need To Master Financial Modeling
Enroll in The Premium Package: Learn Financial Statement Modeling, DCF, M&A, LBO and Comps. The same training program used at top investment banks.
Enroll Today")


