
- What is Accounts Payable?
- What is the Definition of Accounts Payable?
- How to Calculate Accounts Payable on Balance Sheet
- Accounts Payable Formula
- Accounts Payable vs. Receivable: What is the Difference?
- Accounts Payable Journal Entry: Debit or Credit
- Is Accounts Payable a Current Liability?
- How to Find Accounts Payable on Balance Sheet
- What is the Accounts Payable Process?
- How to Optimize Accounts Payable Process
- Accounts Payable vs. Notes Payable: What is the Difference?
- How Does Change in Accounts Payable Impact Cash Flow?
- How to Extend Days Payable Outstanding (DPO)
- How to Forecast Accounts Payable
- What is a Good Accounts Payable?
- How to Calculate Accounts Payable Turnover Ratio
- Accounts Payable Calculator — Excel Template
- 1. Balance Sheet Assumptions
- 2. Accounts Payable Calculation Example
What is Accounts Payable?
Accounts Payable is a current liability recognized on the balance sheet to measure the unpaid bills owed to suppliers and vendors for products or services received but paid for on credit, rather than cash.
Conceptually, accounts payable—often abbreviated as “payables” for short—is defined as the invoiced bills to a company that have still not been paid off.
- Accounts payable is a current liability on a company's balance sheet that represents the unpaid bills owed to suppliers and vendors for products or services paid for on credit, not cash.
- Accounts payable is created when a company receives goods or services from a supplier but delays payment, causing a higher AP balance.
- The formula to calculate accounts payable is equal to the beginning payables balance plus credit purchases, subtracted by supplier payments.
- The journal entry for the accounts payable account is credited when the current liability increases, or debited upon issuance of the cash payment.
- The accounts payable is recognized as a current liability on the balance sheet because the payment obligation is expected to be settled within twelve months.
- If the change in accounts payable is positive, the increase implies an improvement in near-term cash flow (and vice versa).
What is the Definition of Accounts Payable?
In accrual accounting, accounts payable refers to the short-term obligations that a company owes to its suppliers or vendors for goods and services paid for on credit, rather than cash.
The accounts payable line item is recorded in the current liabilities section of the balance sheet since the company is expected to pay off the owed supplier payment soon, most often within 30 to 90 days.
Stated in simple terms, accounts payable represents a current liability that measures the unmet payment obligations still owed to suppliers and vendors by a particular company.
If a company places an order for raw materials and resources from a supplier, the receipt of the ordered items and the invoice from the supplier mandates the recognition of accounts payable on the balance sheet for the current period, irrespective of the fact that the company has not yet paid in cash.
The recognized accounts payable balance on a company’s balance sheet reflects the cumulative unmet payments due to 3rd party creditors, namely suppliers and vendors, per accrual accounting (U.S. GAAP).
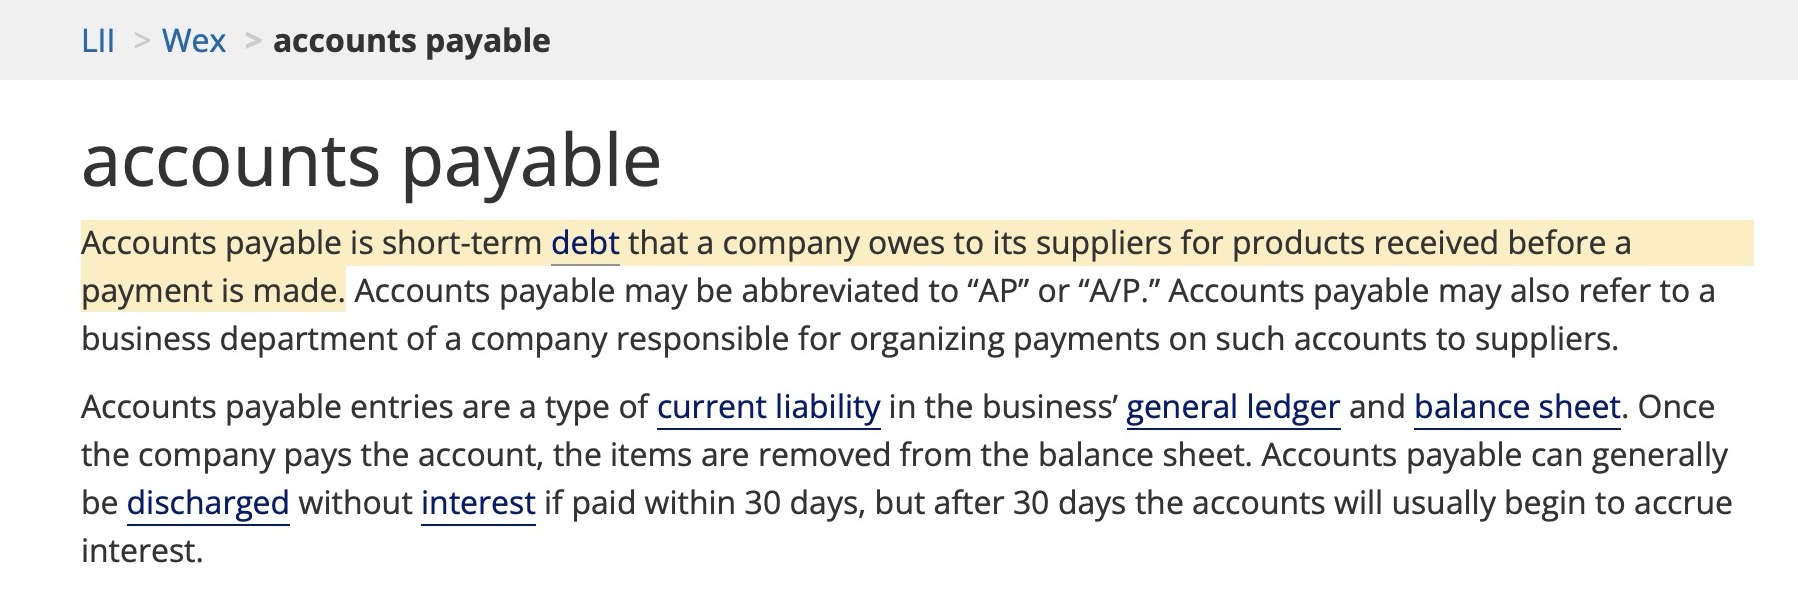
Accounts Payable Definition (Source: LII Wex)
How to Calculate Accounts Payable on Balance Sheet
The first step to calculate the accounts payable on the balance sheet is to determine the opening AP balance at the start of the period (or ending balance in the prior period).
The ending payables balance becomes the beginning balance in the accounts payable roll-forward schedule.
In effect, the accounts payable balance increases when a supplier or vendor extends credit, and vice versa when the company pays in cash (and fulfills the payment obligation to its creditors).
If a company were to place an order to purchase a product or service, the expense is accrued, despite the fact that the cash payment has not yet been paid.
Given the accounts payable balance as of the beginning of the accounting period, the two adjustments that impact the end of period balance is credit purchases and supplier payments.
The process of calculating the ending accounts payable balance for a given period is as follows:
- Step 1 ➝ Determine Beginning Accounts Payable
- Step 2 ➝ Add Credit Purchases (Non-Cash Payments)
- Step 3 ➝ Subtract Cash Payments to Suppliers
Accounts Payable Formula
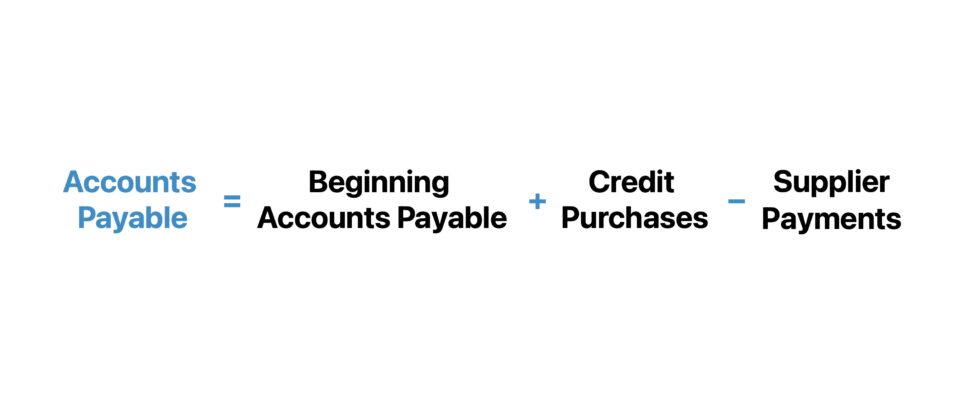
The formula to calculate accounts payable starts with the beginning accounts payable balance, adds credit purchases, and subtracts supplier payments.
Where:
- Ending Accounts Payable ➝ Payables Balance at End of Period (EoP)
- Beginning Accounts Payable ➝ Payables Balance at Beginning of Period (BoP)
- Credit Purchases ➝ Non-Cash Purchase on Credit
- Supplier Payments ➝ Cash Payment Issued to Suppliers
If a company pays its suppliers and vendors in cash immediately upon receipt of the invoice, the accounts payable balance would be near zero.
But companies are incentivized to retain the cash on hand for as long as possible, and extend the payment process.
Why? The cash on hand can be spent on reinvestments, to fund day-to-day working capital needs, and meet unexpected payment obligations.
If a company’s accounts payable balance grows, the company’s cash flow increases (and vice versa) — albeit, the obligation to pay in-full using cash is mandatory.
Accounts Payable vs. Receivable: What is the Difference?
On the balance sheet, the accounts payable (A/P) and accounts receivable (A/R) line item are conceptually similar, but the distinction lies in the perspective (or “point of view”).
Hence, while accounts payable is recognized as a current liability, accounts receivable is recorded in the current assets section of the balance sheet.
Said differently, the accounts payable of a company (or buyer) is the accounts receivable of the 3rd party supplier or vendor owed money for goods and services already delivered.
The difference between accounts payable and accounts receivable is as follows:
- Accounts Payable (AP) ➝ The accounts payables (AP) measures the unmet payment obligations owed to third-parties, such as suppliers and vendors, for goods or services already received.
- Accounts Receivable (A/R) ➝ In contrast, accounts receivables (A/R) are the payments that customers owe to a company for products or services already delivered to them, i.e. an “IOU” from customers who paid in the form of credit, rather than cash.
Accounts Payable Journal Entry: Debit or Credit
For bookkeeping purposes, accounts payable (AP) is recognized as a liability account that maintains a credit balance, barring unusual circumstances.
Upon receipt of an invoice, the company records a “credit” in the accounts payable account with a corresponding “debit” in the expense account.
Suppose a business purchases $20k in inventory and agrees to pay the supplier on a later date, rather than the present date.
The impact of the transaction is a debit entry to the “Inventory” account, with a credit entry to the “Accounts Payable” account, reflecting the increase in the current liability balance.
Accounts Payable Journal Entries
- Inventory Account ➝ Debit
- Accounts Payable Account ➝ Credit
| Journal Entry | Debit | Credit |
|---|---|---|
| Inventory (Raw Material) | $20,000 | — |
| Accounts Payable (AP) | — | $20,000 |
Once the payment is made, the accounts payable account is debited, and the cash account is credited.
| Journal Entry | Debit | Credit |
|---|---|---|
| Accounts Payable (AP) | $20,000 | — |
| Cash | — | $20,000 |
If a company is owed more payments in the form of cash from customers that paid using credit, the “Accounts Payable” account is credited to reflect the increased obligation.
Conversely, if the company is the party that owes cash to a supplier or vendor, the issuance of the payment to settle these debt is recorded as a debit on the “Accounts Payable” account.
The credit balance reflects the total amount the company still owes to its suppliers or vendors for goods or services received but not yet paid for.
Is Accounts Payable a Current Liability?
The accounts payable (AP) line item is recognized as a current liability on the balance sheet prepared under U.S. GAAP reporting standards.
The balance sheet, or “statement of financial position”, is one of the core financial statements that offers a snapshot of a company’s assets, liabilities and shareholders equity at a specific point in time.
In short, accounts payable are considered current liabilities because the outstanding balance represents money owed by a business to its suppliers and vendors.
Current liabilities represent future outflows of cash expected to be settled within 12 months, which is a criteria that accounts payable meets.
- Current Liability ➝ Obligation Due Date <12 Months
- Non-Current Liability ➝ Obligation Due Date >12 Months
On the income statement, expenses must be recorded once incurred per accrual accounting standards, so the timing of the recognition is the period in which the invoice is received, rather than when the company paid the supplier or vendor.
Therefore, accounts payable is classified in the current liabilities section of the balance sheet, as the accumulation of unfulfilled payment obligations imply a future “outflow” of cash.
The outstanding payment owed to suppliers and vendors by a business will remain constant until the payment obligation is fulfilled (i.e. the payment is paid for in-full via cash).
Upon receipt of the cash payment, the recorded accounts payable balance will reduce accordingly (and the balance sheet equation must remain true).
How to Find Accounts Payable on Balance Sheet
The “Accounts Payable” line item is recorded in the current liabilities section of the balance sheet.
The outstanding obligation to fulfill the payment in the form of cash to the supplier or vendor for the product or service received is anticipated to be paid in-full within the next 30 to 90 days.
Usually, the accounts payable is recognized near the top of the current liabilities section.
Why? The payments owed by the business are expected to be issued soon after the issuance of the invoice from the perspective of suppliers and vendors.
If the outstanding balance is not settled in a reasonable time, however, the supplier or vendor has the right to pursue legal action to claim the payment owed.
The drawback to taking an enterprise customer to Court, at the risk of stating the obvious, is that the business relationship between the two is likely irrepairable.
The change in accounts payable is recorded on the cash flow statement (CFS) in the cash flow from operating activities (CFO) section.
Based on the increase or decrease tracked on the cash flow statement (CFS), the change in accounts payable is the net impact that impacts the carrying value of the current liability on the balance sheet.
For a real-life example, Alphabet (GOOGL) reported $7.5 billion and $6.2 billion in accounts payable for Q-4 2023 and Q1 2024, reflecting a reduction of approximately 21% Q/Q.
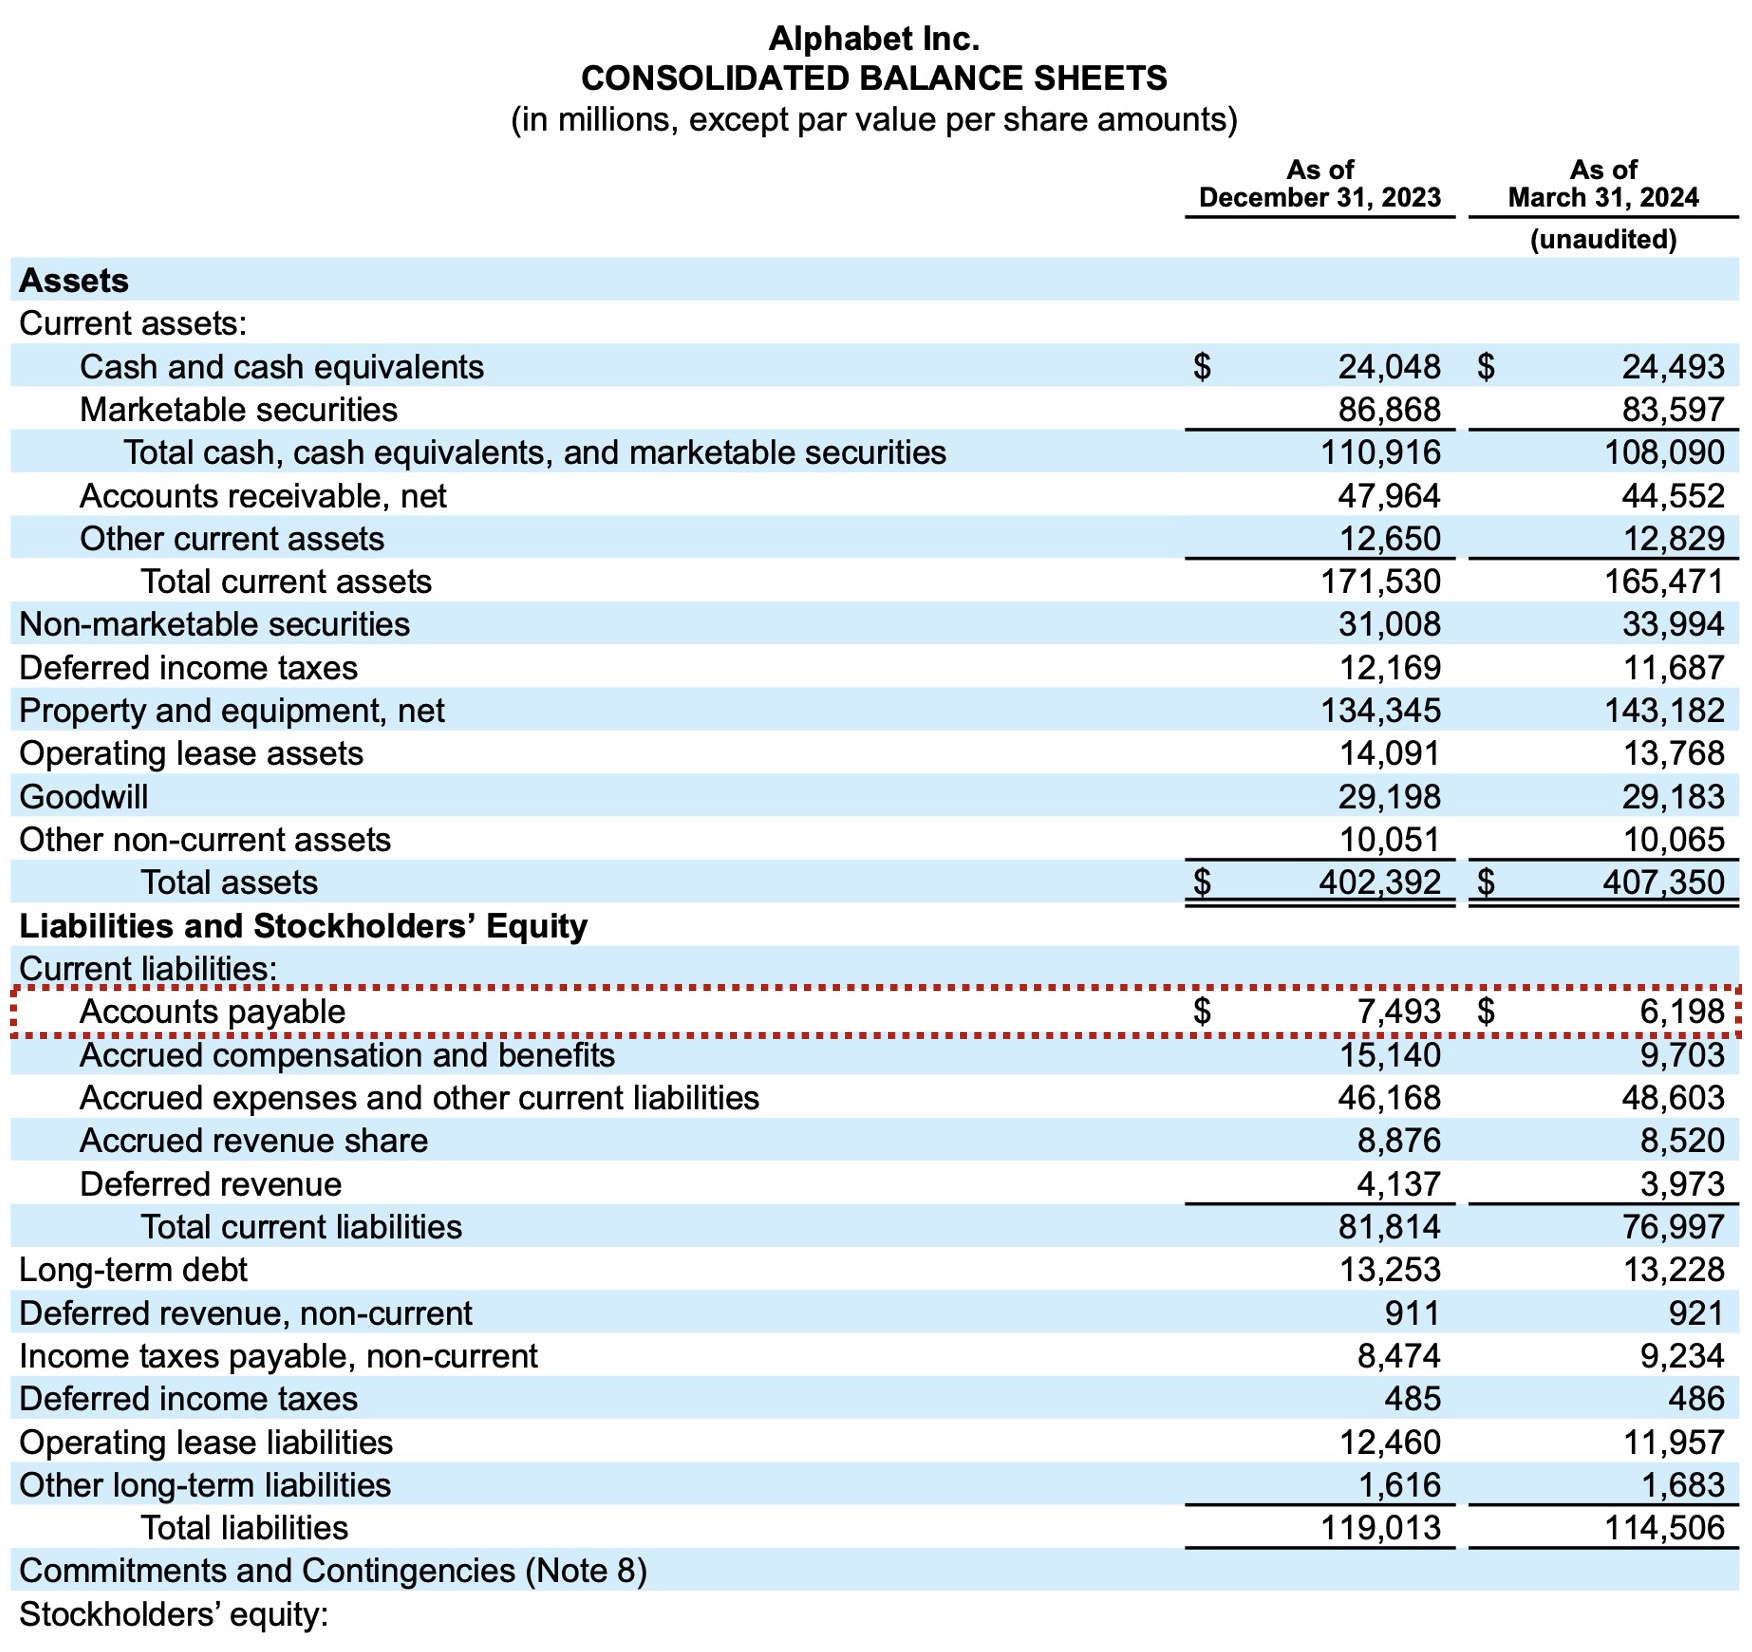
Accounts Payable Example on Balance Sheet (Source: Alphabet, Inc. 10-Q)
What is the Accounts Payable Process?
The standard accounts payable cycle is characterized by three steps (and coinciding documents):
- Purchase Order (PO) ➝ The purchase order (PO) is a formal document sent by the buyer to the seller stating the commitment to pay for the goods or services expected to be received.
- Receiving Report ➝ The receiving report, or “goods receipt”, is a document intended to confirm the receipt of goods or services from a supplier for record keeping purposes.
- Vendor Invoice ➝ The vendor invoice, or “bill”, is a document that a supplier or vendor issues to a customer that purchased goods or services (and now has the obligation to pay).
Starting off, the accounts payable process initiates after a company’s purchasing department issues a purchase order (PO) to a supplier or vendor.
The purchase order (PO) document specifies the desired merchandise, quantities, and prices, and serves to initiate the order transfer (i.e. the goods move from the supplier to the customer).
Upon receipt of the goods, the company records the details of the shipment, including any discrepancies in quantity and damage via a receiving report. For example, the purchased items could have arrived in poor condition or the wrong quantity could have been sent.
Once received and processed, the vendor issues an invoice to the company, requesting payment for the goods or services delivered.
The invoice is received by the accounts payable (AP) department of the company, marking the conclusion of the invoice management process.
How to Optimize Accounts Payable Process
If a company’s internal accounts payable process and collection policies are efficient, the outcome is an increase in free cash flow (FCF) and reduction in liquidity risk.
The fewer customer payments owed to a company, the less liquidity risk attributable to a company (and vice versa).
- Accounts Payable Department ➝ Most established corporations nowadays have an accounting division comprised of a dedicated accounts payable department functions to closely monitor and track the customers with an outstanding balance.
- Accounts Payable Automation Software ➝ But in recent times, the emergence of accounting software startups to improve the workflow and operating efficiency of corporations has led to the creation of platforms that automate accounts payable processing, where customers are sent automated invoices and payment reminders.
The current trend of accounts payable workflow automation should serve as an favorable industry tailwind that contributes toward more operational efficiency, cash reserves, and quicker collection of timely payments from customers (including fewer fraudulent invoices).
Accounts Payable vs. Notes Payable: What is the Difference?
In accounting, accounts and notes payable are each liabilities recorded on the balance sheet. But despite the similarities in the name, the two terms are not interchangeable.
- Accounts Payable ➝ Accounts payable are short-term liabilities that arise from regular business transactions for goods and services received on credit. While payables represent mandatory payment obligations, there are no interest payment obligations owed to the supplier or vendor (and no formal written contract stating the financing terms, aside from the transaction terms). The accounts payable of a company carry relatively short term maturities, ranging between 30 to 60 days on average, and are thus classified as current liabilities on the balance sheet.
- Notes Payable ➝ Notes payable, on the other hand, are classified as long-term liabilities representing formal loan agreements or promissory notes issued for borrowing money. These long term obligations come with mandatory interest payments, including the repayment of the original principal borrowed, akin to traditional debt. Unique to notes payable, the liability functions as a legally binding promissory note with the specific terms outlining the interest rate, repayment schedule, and maturity date.
Trade Payable vs. Accounts Payable: What is the Difference?
Trade payables measure the cash payments owed to vendors to compensate for past orders of inventory-oriented resources.
Therefore, the concept of trade payable is deemed a subset of accounts payable, which is more comprehensive in terms of the short-term payment obligations that comprise the line item.
How Does Change in Accounts Payable Impact Cash Flow?
From the perspective of a company (or the buyer), there is a clear incentive to reduce the money owed by customers that paid on credit (and to collect cash for products and services already delivered).
The less cash tied up in working capital, the more discretionary free cash flow (FCF) is available to the company, which can be spent on reinvestment activity like funding growth and maintenance capital expenditures (Capex) — or the purchase of fixed assets (PP&E).
If a company’s accounts payable is consistently on the higher end relative to that of comparable companies, the trend is perceived as a positive sign, according to equity analysts, investors, and other stakeholders in the market.
The relationship between the change in accounts payable (AP) and the impact on free cash flow (FCF) is as follows:
- Increase in Accounts Payable ➝ The company delayed the issuance of payments to its suppliers or vendors, where the cash remains in the possession of the company in the meantime.
- Decrease in Accounts Payable ➝ The suppliers or vendors were paid by the company with cash as the form of consideration, causing the outstanding accounts payable balance to decline.
How to Extend Days Payable Outstanding (DPO)
The economic incentive structure for a company managing its accounts payable is distinct from the aforementioned. As a matter of fact, the two are conceptually contradictory to each other.
Therefore, an increase in accounts payable is reflected as an “inflow” of cash on the cash flow statement, while a decrease in accounts payable is shown as an “outflow” of cash.
Of course, companies must complete invoice payments and vendor payments in a timely manner to receive favorable terms from suppliers and vendors (or else, the company is at risk of the supplier/vendor cutting ties and no longer interested in conducting businesss transactions).
If not, the buyer likely contributes a significant percentage of the total revenue of a supplier or vendor, and the continued relationship is critical to their long-term viability, especially for those that produce and distribute niche resources.
By pushing back and delaying the required payments—a common business practice termed “extending payables”—despite already receiving the benefits as part of the transaction, the cash belongs to the company for the time being, with no restrictions on how it can be used.
From the perspective of suppliers and vendors, landing major multi-year contracts with large purchase volumes and global branding cause them to lose negotiating leverage; hence, the ability of certain companies to extend payables.
Other business methods and tactics that can contribute toward a company extending ts days payable outstanding (DPO) include the following strategies:
- Higher Order Frequency ➝ Large Order Volume on a Frequent-Basis
- Increase Order Size ➝ Large Order Size on a Dollar-Basis
- Improve Customer Trust ➝ Long-Term Relationship with Customer (i.e. Consistent Track Record)
- Limited Competition ➝ Smaller-Sized Market with Fewer Potential Customers (e.g. Acquisition of Competitor)
How to Forecast Accounts Payable
The days payable outstanding (DPO) measures the number of days it takes for a company to complete a cash payment post-delivery of the product or service from the supplier or vendor.
In practice, the days payable outstanding (DPO)—or “AP Days”—is the most common operating driver to project the accounts payable of a company in a pro forma financial model.
Where:
- Average Accounts Payable = (Beginning + Ending Accounts Payable) ÷ 2
- Cost of Goods Sold (COGS) = Gross Profit – Revenue
The common methods to forecast accounts payable on the balance sheet are the following:
- Historical Precedence ➝ The historical trends and patterns are commonly referenced to guide the underlying operating assumptions that drive the AP forecast, including the positive or negative trajectory in recent periods.
- Straight Line Method ➝ The simplest method to project AP is to simply link toward the most recent operating assumption (i.e. DSO), and call it a day. The decision to straight-line an assumption is only appropriate if the operating drivers have remained consistent in the trailing periods.
- Industry Benchmark ➝ The peer group of the target company can be analyzed to derive an average based on historical operating performance, which can be applied to the target (i.e. converge toward the industry average as part of performing a “sanity check”).
With that said, the formula for the projected accounts payable balance using the company’s days payables outstanding (DPO) assumption is as follows.
To elaborate on the forecasting of the accounts payable line item in financial modeling, the payables line item is usually tied to COGS in most models, especially if the company sells physical goods.
How Buyer Power Impacts Days Payable Outstanding (DPO)
Common examples of real-life companies with significant buyer power include Amazon (AMZN), Apple (AAPL), and Walmart (WMT).
Each of the three publicly-traded companies—as their business model, branding, and global presence became more established with time—has created long term benefits in the form of buyer power, granting them with the option to extend their payables (i.e. the payments owed to suppliers and vendors).
While one could criticize the ethics of such business practices, the disproportionate concentration of the revenue on the leading, multi-national companies—the customers of the suppliers and vendors—is worth the trade-off for most.
What is a Good Accounts Payable?
The accounts payable metric, by itself, offers minimal insights into the operating efficiency of a company. Hence, the necessity to calculate the days payable outstanding (DPO) of a company on a trailing-basis.
Since we’re analyzing the accounts payable process and collection policies from the perspective of the provider—i.e. the business to whom customers owe money—the days sales outstanding (DSO) can be used to measure the efficiency at which credit sales are converted into cash on hand.
In the event that an unanticipated spending emerges at random, a business with a healthy cash balance and strong liquidity profile—including sufficient cash reserves in preparation for such scenarios—is well-positioned to navigate the circumstances.
Given a company’s historical days payables outstanding (DPO), or “AP Days”, the working capital metric serves as a practical benchmark by which a company’s management of payables can be analyzed.
The general rules of thumb that pertain to understanding the historical trend of a company’s days payable outstanding (DPO) is as follows:
- Rising Days Payable Outstanding (DPO) ➝ If a company’s AP days increase over time, the upward trend implies the attainment of more buyer power (and negotiating leverage).
- Declining Days Payable Outstanding (DPO) ➝ If a company’s AP days decrease over time, the downward trajectory implies there is more bargaining power in favor of the supplier.
In short, a higher days payable outstanding (DPO) is often indicative of a company’s operations becoming more efficient, since its free cash flow (FCF) improves.
However, the underlying cause of the upward trend must be identified, because the rise should stem from sources like improvements in the company’s relationships and negotiating leverage with long-term suppliers and vendors.
Conversely, if a company’s AP days are rising from the inability to meet the payment obligations, the expansion in days payables is not by choice, and is a valid cause for concern that can easily place the company at risk of no longer operating as a going concern (and insolvency).
How to Calculate Accounts Payable Turnover Ratio
The accounts payable turnover ratio, or AP turnover ratio, is an operational metric that measures the efficiently at which a company pays off its suppliers and creditors over a specific period.
The AP turnover ratio is a short-term measure of liquidity that tracks the rate at which a company settles its accounts payable, reflecting the company’s ability to manage its short-term obligations.
The accounts payable turnover ratio quantifies the number of times a company pays off its accounts payable across a given period, most often a year (i.e. 12 months).
The formula to calculate the accounts payable turnover ratio is equal to the total supplier payments divided by the average accounts payable balance.
Where:
- Total Supplier Purchases ➝ The total amount spent on credit purchases from suppliers.
- Average Accounts Payable ➝ The average AP is the sum of the beginning and ending accounts payable balances for the period divided by two.
Accounts Payable Calculator — Excel Template
We’ll now move to a modeling exercise, which you can access by filling out the form below.
1. Balance Sheet Assumptions
Suppose we’re tasked with calculating the historical accounts payable of a company and building a pro forma forecast.
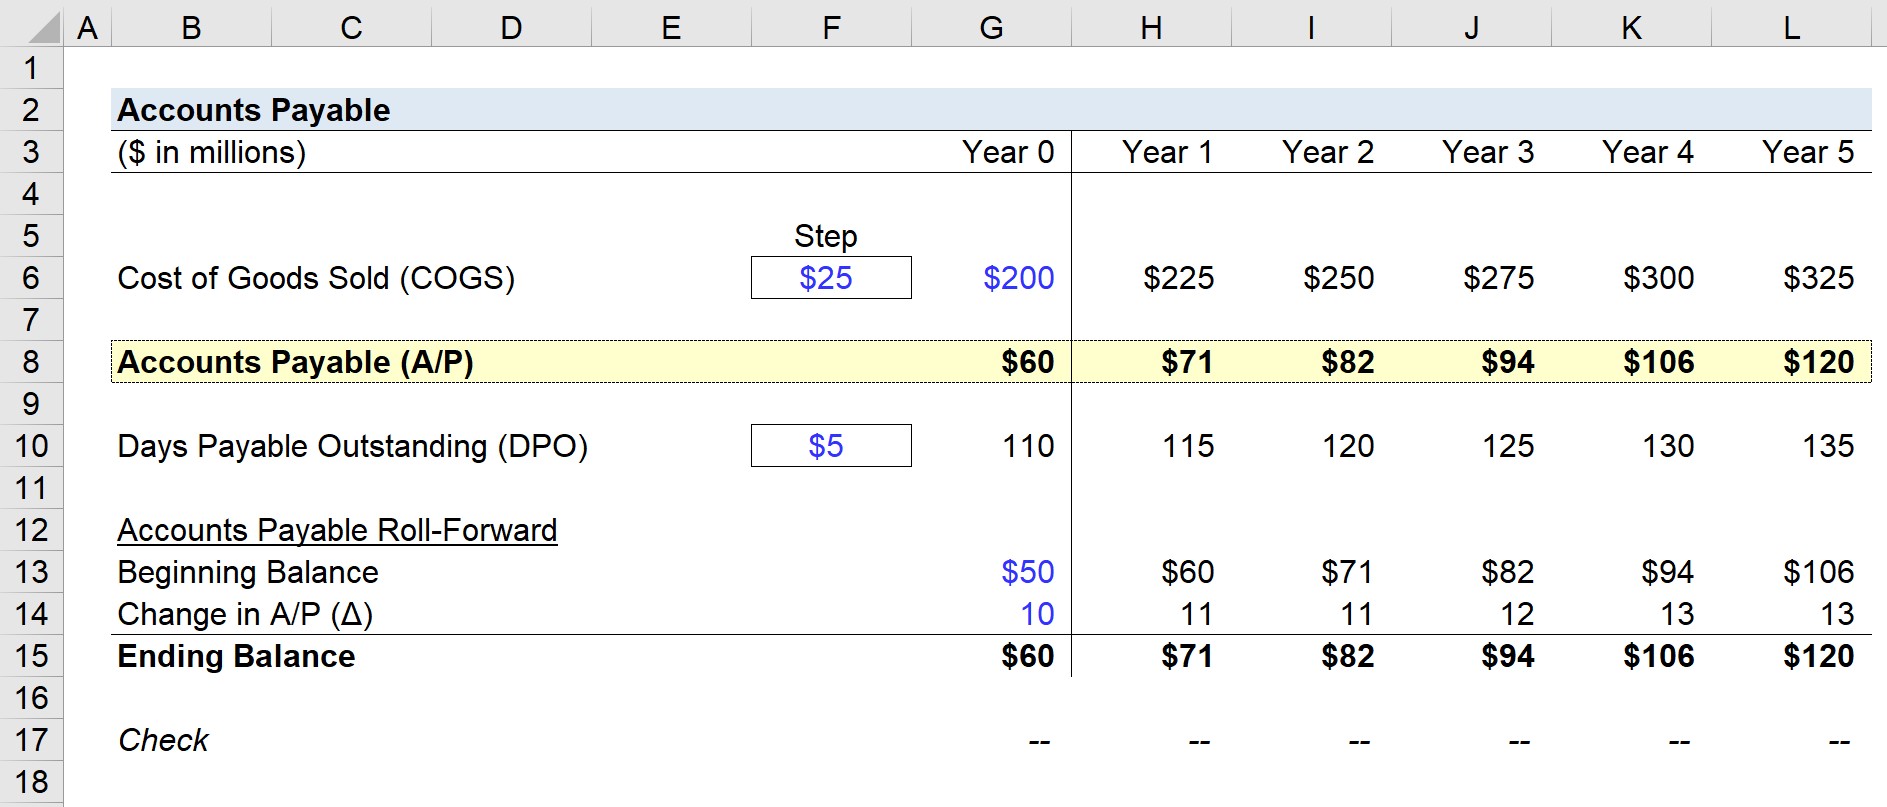
Based on the company’s latest financial statements, a total of $200 million was incurred in cost of goods sold (COGS) in Year 0.
- Cost of Goods Sold (COGS) = $200 million
At the beginning of the period, the accounts payable balance was $50 million, but the change in A/P was an increase of $10 million, so the ending balance is $60 million in Year 0.
- Beginning Accounts Payable = $50 million
- Change in AP = $10 million
- Ending Accounts Payable = $60 million
For Year 0, we’ll calculate our company’s days payable outstanding (DPO) using the following formula:
- Days Payables Outstanding (DPO) – Year 0 = ($60 million ÷ $200 million) × 365 Days = 110 Days
Therefore, the number of days needed by the company to complete supplier invoices is estimated to be ~110 days on average, as of Year 0.
2. Accounts Payable Calculation Example
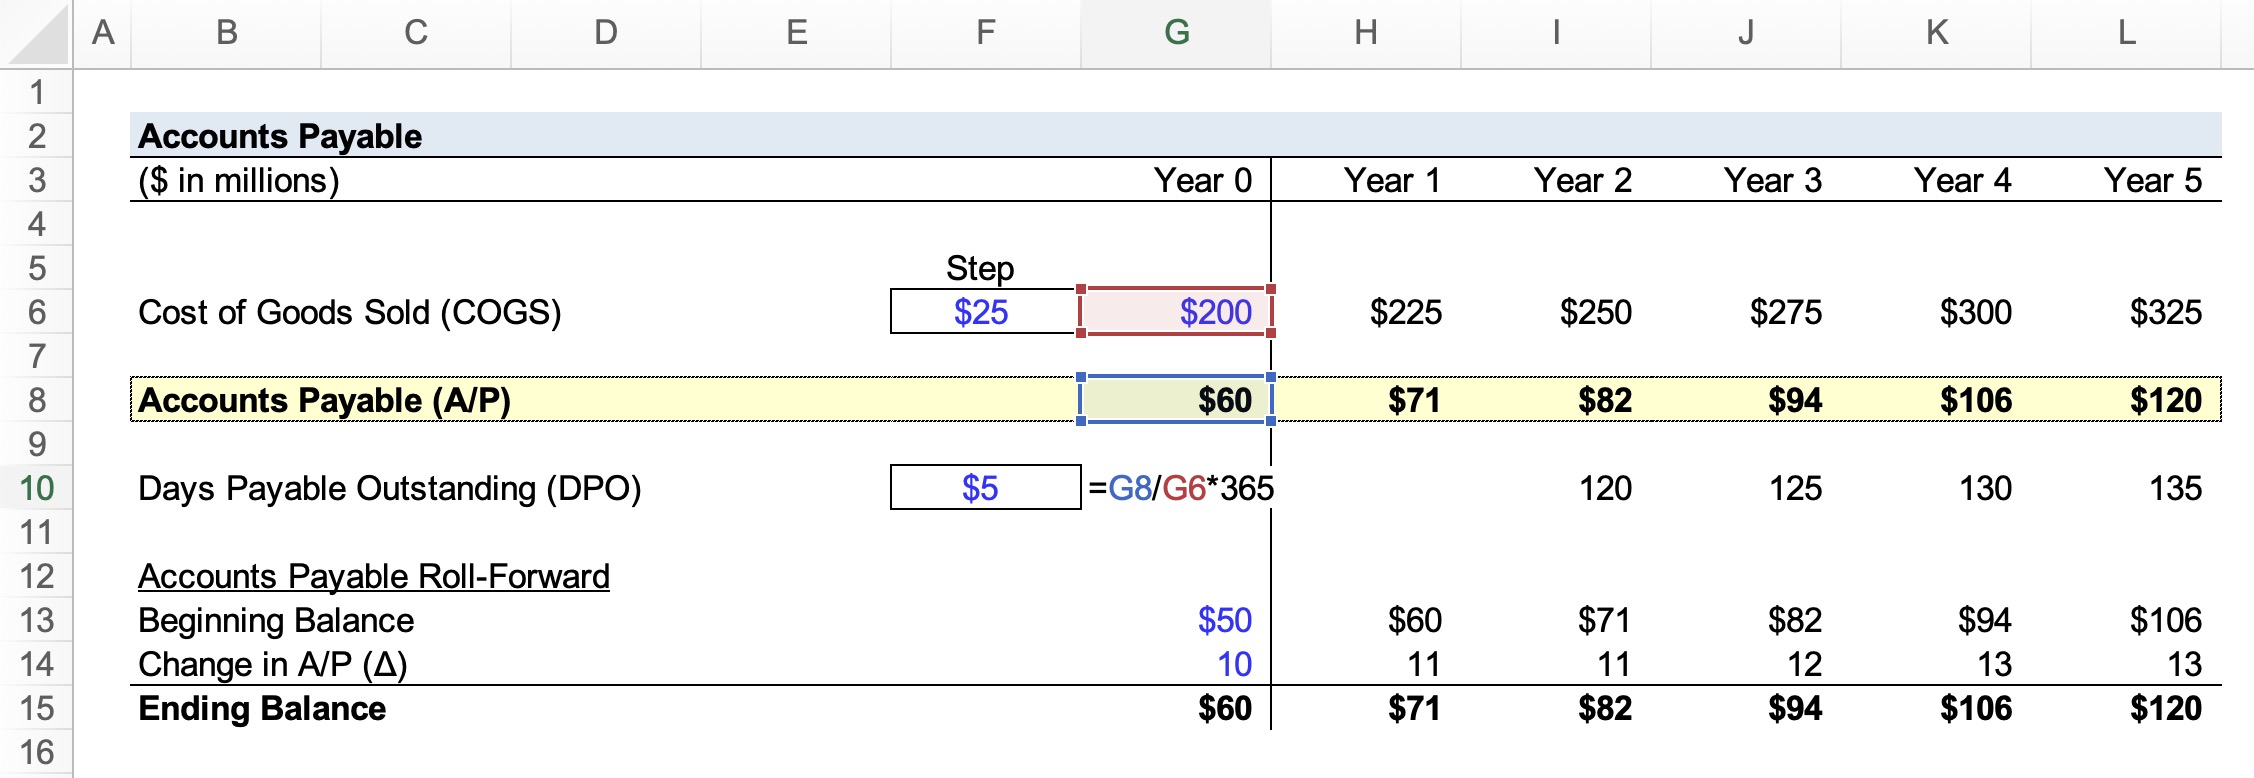
For the forecast period—from Year 1 to Year 5—we’ll set a step function, wherein cost of goods sold (COGS) and days payables outstanding (DPO) will increase by a fixed amount per year.
AP Forecast — Step Function
- Cost of Goods Sold (COGS) ➝ Increase by $25 million per Year
- Days Payables Outstanding (DPO) ➝ Increase by $5 million per Year
Now, we’ll extend the assumptions across our forecast period until we reach a COGS balance of $325 million in Year 5 and a DPO balance of $135 million in Year 5.
For example, to calculate the accounts payable for Year 1, the formula shown below is used:
- Accounts Payable (Year 1) = (115 ÷ 365 Days) × $225 million = $71 million
- Accounts Payable (Year 2) = (120 ÷ 365 Days) × $250 million = $82 million
- Accounts Payable (Year 3) = (125 ÷ 365 Days) × $275 million = $94 million
- Accounts Payable (Year 4) = (130 ÷ 365 Days) × $300 million = $106 million
- Accounts Payable (Year 5) = (135 ÷ 365 Days) × $325 million = $120 million
Starting from Year 0, the accounts payable balance doubles from $60 million to $120 million by the end of Year 5, as captured in the AP roll-forward schedule.
The change in accounts payable subtracts the ending balance in the current year from the prior year’s ending balance.
The cause of the increase in accounts payable (and cash flows) is the increase in days payable outstanding, which increases from 110 days to 135 days under the same time span.
The ending balance in the accounts payable (AP) roll-forward schedule represents the outstanding payments owed to suppliers or vendors.
In closing, the remaining payment obligation flows into the accounts payable line item on the company’s balance sheet for the current period.

Everything You Need To Master Financial Modeling
Enroll in The Premium Package: Learn Financial Statement Modeling, DCF, M&A, LBO and Comps. The same training program used at top investment banks.
Enroll Today


Very Helpful and Simple to understand.
Good!!