What is Consumer Surplus?
A Consumer Surplus is present when the actual prices paid by consumers for goods and services are less than the maximum prices at which they would be willing to pay.
How Does a Consumer Surplus Work?
In economics, a consumer surplus is measured to quantify the monetary benefits resulting from favorable (or unfavorable) market conditions.
Since pricing is a byproduct of the prevailing market competition within the economy, higher levels of competition lead to more benefits on the consumer side.
On the other hand, increased competition in the market tends to contribute to a more challenging environment to obtain higher profit margins.
Generally speaking, the prices of goods and services tend to decline once the product has become commoditized. In particular, the barriers to entry in a commoditized market are low and the level of competition is high, meaning that competition becomes oriented around prices, which tends to erode the profitability of market participants.
So if the price paid by consumers to complete the purchase of a product or service is less than the maximum price that they would be willing to pay for it (i.e. the “ceiling” as set by supply/demand), there is a consumer surplus in the market.
How to Calculate Consumer Surplus
The difference between the actual price paid and the maximum price that consumers are willing to pay represents the marginal benefit received by the consumers.
Simply put, consumers can purchase goods and services for less than the maximum amount they would be willing to pay.
The concept of a consumer surplus is derived from the economic theory of marginal utility, which is defined as the additional benefit a consumer receives from one more unit of a good or service.
All else being equal, the greater the supply of a good or service (i.e. the number of sellers and available options) and the more accessible that it is, the more likely that consumers already have it.
For those not in possession of the good or service, the amount that consumers are willing to spend tends to decline given the environment that favors buyers over sellers.
The relationship between pricing and the consumer surplus is the following:
- Higher Pricing → Increased Consumer Surplus
- Lower Pricing → Decreased Consumer Surplus
The Wharton Online & Wall Street Prep Applied Value Investing Certificate Program
Learn how institutional investors identify high-potential undervalued stocks. Enrollment is open for the Feb. 10 - Apr. 6 cohort.
Enroll TodayConsumer Surplus Formula
To reiterate from earlier, the consumer surplus quantifies the difference between the price that a consumer is willing to pay to purchase an item and the market price at which the transaction could be fulfilled.
The total economic surplus is the sum of the consumer and producer surplus, which refers to the benefit received by producers from the market price exceeding the prices that consumers are willing to pay.
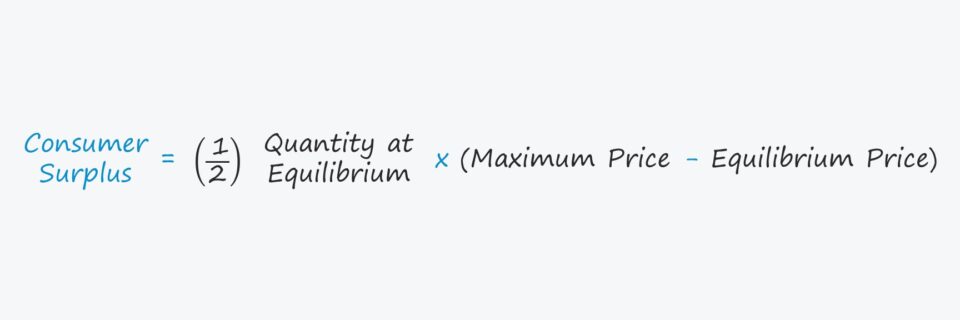
The simplest formula for calculating the consumer surplus is as follows:
From there, the expanded variation of the formula is the following:
Where:
- Quantity → The total market demand for a given good or service at equilibrium.
- Maximum Price → The maximum price that consumers are willing to pay.
- Equilibrium Price → The price at equilibrium per the supply and demand graph.
Graph of Total Economic Surplus
The total economic surplus is comprised of consumer and producer surplus, so it measures the net utility received by consumers in a particular market.
At the core of the theory, the underlying question here is, “How much are consumers willing to pay at most in order to purchase the good?”
On the supply and demand curve, the area between the equilibrium price and the demand curve signifies the consumer surplus.
The equilibrium price is where the market price matches the consumer demand, so there is neither a shortage nor a surplus.
When illustrated visually on a supply and demand chart, the consumer surplus is the triangular area located below the demand curve, i.e. the section below the demand curve reflects the willingness of consumers in a market to pay for a good or service at different set prices.
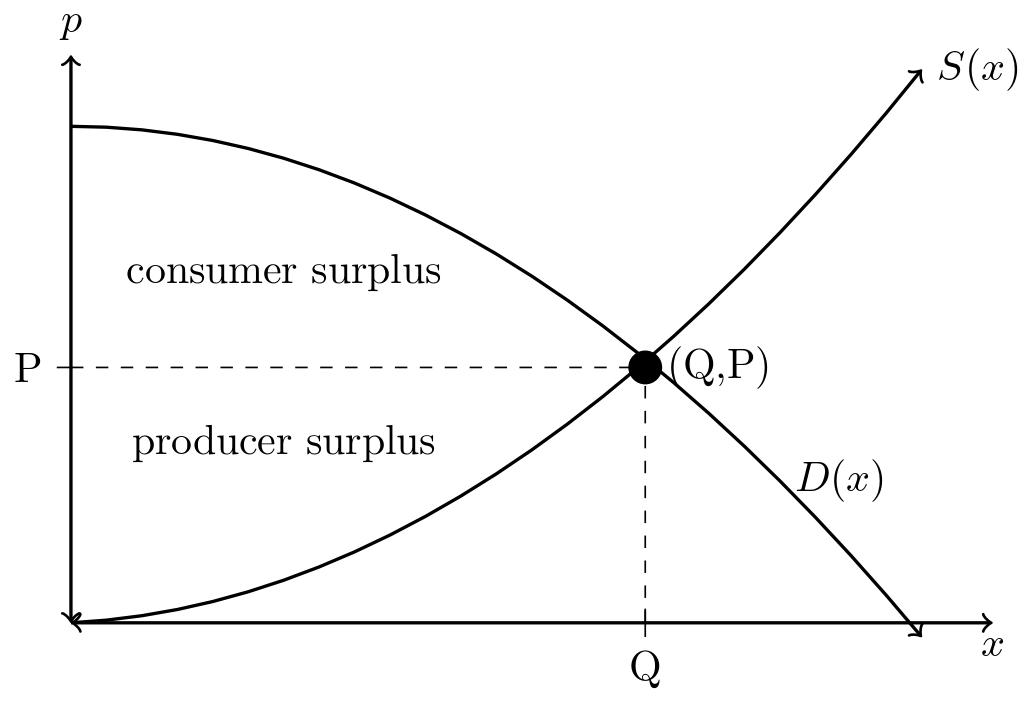
Economic Surplus Graph (Source: UNL)
Consumer Surplus Calculator
We’ll now move to a modeling exercise, which you can access by filling out the form below.
Consumer Surplus Calculation Example
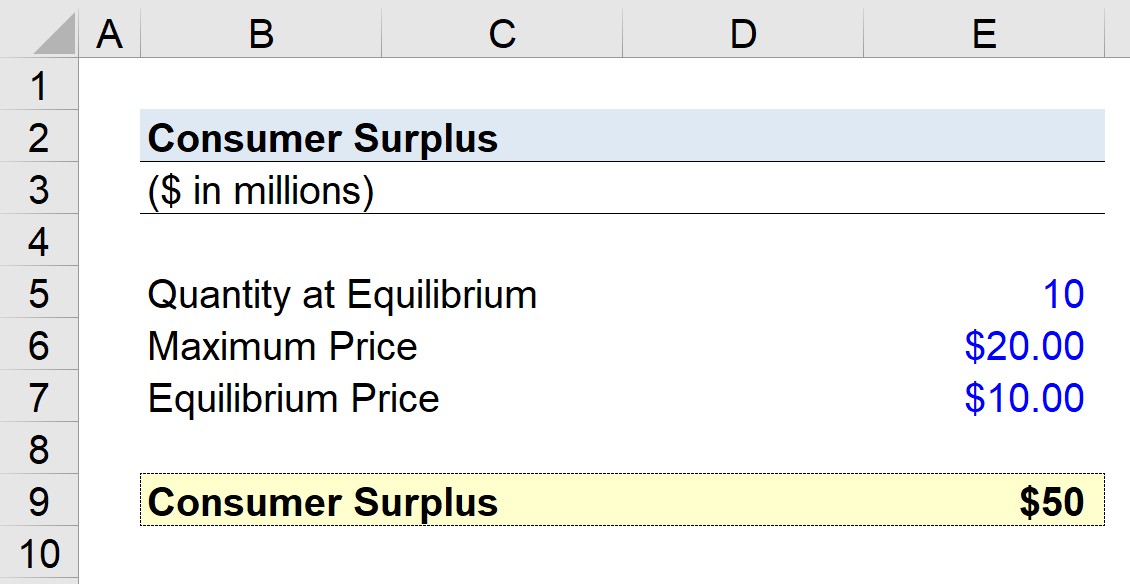
Suppose we’re calculating the consumer surplus for a hypothetical product.
We’ll use the following set of assumptions for our simplified exercise.
- Quantity at Equilibrium = 10 million
- Maximum Price = $20.00
- Equilibrium Price = $10.00
Therefore, the spread between the maximum price that consumers are willing to pay and the equilibrium price is $10.00.
Once our inputs are entered into our formula from earlier, the expanded variation, we arrive at a surplus of $50 million.
- Consumer Surplus = (1/2) × 10 million × ($20.00 – $10.00) = $50 million