What is Information Ratio?
The Information Ratio quantifies the excess portfolio returns over the returns of a benchmark, relative to the volatility of the excess returns.
In short, the information ratio represents the excess return over a benchmark – most often the S&P 500 – divided by a tracking error, which is a measure of consistency.
How to Calculate Information Ratio
The information ratio (IR) measures the risk-adjusted returns on a portfolio in relation to a specified benchmark, which is normally an index representing the market (or sector).
The term frequently comes up when discussing active management (i.e. hedge fund managers) and judging their ability to generate consistent excess returns on a risk-adjusted basis.
The usage of a tracking error – i.e. the standard deviation of the portfolio and the performance of the chosen index, such as the S&P 500 – in the calculation considers the consistency of the returns to ensure a sufficient time frame (and different economic cycles) are considered, not just one outperforming or underperforming year.
- Low Tracking Error → Less Volatility and Consistency in Portfolio Returns Exceeding the Benchmark
- High Tracking Error → High Volatility and Inconsistency in Portfolio Returns Exceeding the Benchmark
In short, the tracking error reflects how the performance of a portfolio deviates from the selected benchmark’s performance.
Portfolio managers that actively manage a portfolio strive to achieve a higher information ratio, as it implies consistent risk-adjusted returns in excess of the set benchmark.
Below are the steps to calculate the information ratio:
- Calculate the Portfolio Return for a Given Period
- Subtract the Portfolio Return by the Tracked Benchmark Index Return
- Divide the Resulting Figure by the Tracking Error
- Multiply by 100 to Express as a Percentage
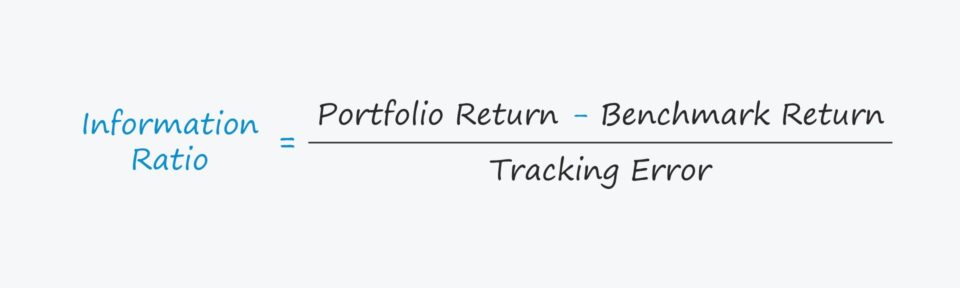
Information Ratio Formula
The formula for calculating the information ratio is as follows.
Where:
- Excess Return → The numerator of the ratio, i.e. the excess return, is the difference between a portfolio manager’s returns and that of the benchmark.
- Tracking Error → The denominator, i.e. the tracking error, is a less straightforward calculation, as the standard deviation captures the volatility of the excess return.
The Wharton Online & Wall Street Prep Applied Value Investing Certificate Program
Learn how institutional investors identify high-potential undervalued stocks. Enrollment is open for the Feb. 10 - Apr. 6 cohort.
Enroll TodayInformation Ratio vs. Sharpe Ratio: What is the Difference?
The Sharpe ratio, much like the information ratio, attempts to measure the risk-adjusted returns on a portfolio or financial instrument.
In spite of the shared objective, there are some notable differences between the two metrics.
For instance, the Sharpe ratio formula is calculated as the difference between the portfolio return and the risk-free rate (i.e. 10-year government bonds), which is subsequently divided by the standard deviation of the portfolio’s returns.
In contrast, the information ratio compares the risk-adjusted return in relation to a benchmark, rather than in relation to the return on risk-free securities.
Moreover, the information ratio also considers the consistency of a portfolio’s performance, unlike the Sharpe ratio.
Information Ratio Calculator
We’ll now move to a modeling exercise, which you can access by filling out the form below.
Fund Information Ratio Calculation Example
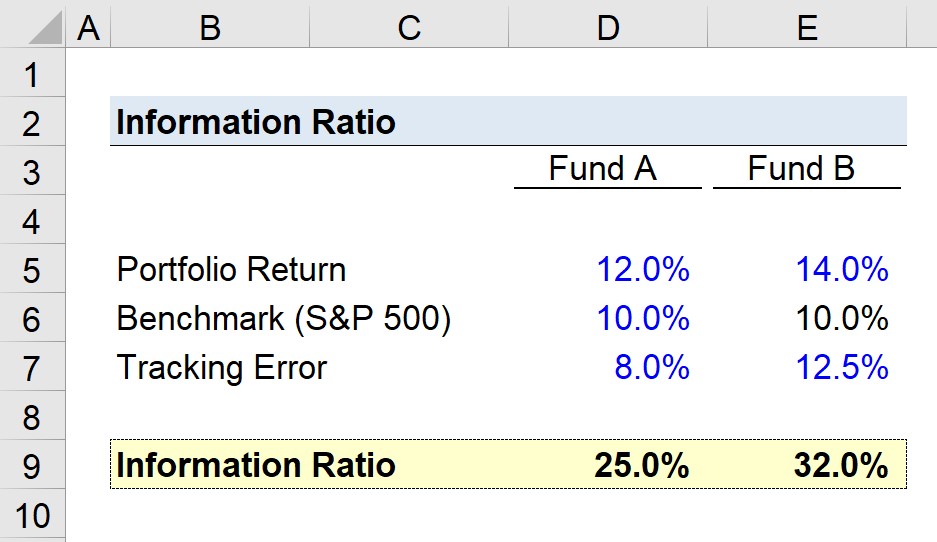
Suppose we’re comparing the returns performance of two hedge funds, which we’ll refer to as “Fund A” and “Fund B”.
The portfolio returns of both hedge funds are as follows.
- Portfolio Return, Fund A = 12%
- Portfolio Return, Fund B = 14%
The chosen benchmark rate is the S&P 500, which we’ll assume returned 10%.
- Benchmark (S&P 500) = 10.0%
The tracking error was 8% for Fund A and 12.5% for Fund B.
- Tracking Error, Fund A = 8%
- Tracking Error, Fund B = 12.5%
With our inputs in place, the only remaining step is to take the difference between the portfolio return and the benchmark rate, and then divide it by the tracking error.
- Information Ratio, Fund A = (12% – 10%) ÷ 8% = 25%
- Information Ratio, Fund B = (14% – 10%) ÷ 12.5% = 32%
Fund B is therefore implied to generate more excess returns, more consistently.