
What is Default Risk Premium?
The Default Risk Premium (DRP) measures the incremental return that investors require as compensation for undertaking the risk of holding a risky security, such as a corporate bond.
How to Calculate Default Risk Premium (DRP)?
The default risk premium (DRP) represents the compensation that investors demand for bearing the risk that a given security might default.
Default risk is a major component of credit risk that captures the likelihood of a company failing to make timely payments on its financial obligations, namely:
- Interest Expense → The periodic payments to the lender throughout the term of the debt (i.e. the cost of debt financing).
- Mandatory Amortization → The required paydown of the debt principal during the lending period.
The default risk premium (DRP) refers to the incremental return required by lenders in exchange for assuming more risk by providing debt capital to a specific borrower.
The inclusion of the default risk premium in lending is to provide more compensation for a lender in proportion to the additional assumed risk.
Simply put, the default risk premium is defined as the difference between the interest rate pricing on a debt instrument (e.g. loan, bond) and the risk-free interest rate.
Therefore, one method for lenders to earn greater yields by providing capital to borrowers with higher risk profiles (i.e. chance of default) is by demanding higher interest rates.
The default risk premium (DRP) calculation requires two inputs:
- Yield to Maturity (YTM) of a Risk-Free Security (e.g. U.S. Treasury Bond)
- Yield to Maturity (YTM) of a Risky Bond (e.g. Corporate Bond)
Default Risk Premium Formula
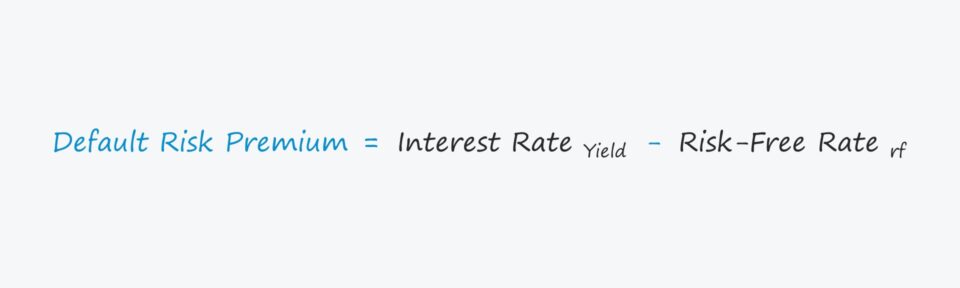
The formula for estimating the default risk premium is as follows.
The interest rate charged by the lender, i.e. the yield received by providing the debt capital, is subtracted by the risk-free rate (rf), resulting in the implied default risk premium, i.e. the excess yield over the risk-free rate.
For example, if the yield on a corporate bond is 6.0% while a comparable U.S. Treasury bond is yielding 3.0%, the default risk premium is 3.0%
- Default Risk Premium (DRP) = 6.0% – 3.0% = 3.0%
However, please note the formula described above is a simplified variation meant to help conceptualize how the risk of default is priced into the interest rate by lenders.
In reality, there are far more variables at play that can determine the interest rate charged than the risk of default.
There are often country-specific risks and industry-specific risks like regulations that can impact the default risk of a company.
What is a Good Default Risk Premium?
All forms of investing, whether it be in equity or debt securities, come down to a trade-off between risk and return.
That said, if there is more risk taken on by the investor, there must be more returns in exchange.
Conceptually, the default risk premium captures the perceived risk that a borrower might be unable to fulfill its obligation to meet required debt payments (e.g. interest expense) in a timely manner, or fail to repay the principal in-full at maturity.
- Higher Default Risk → Higher Default Risk Premium (and Higher Interest Rate)
- Lower Default Risk → Lower Default Risk Premium (and Lower Interest Rate)
A higher likelihood of default not only increases the risk to debt investors but to equity shareholders, as well.
If a company defaults on financial obligations and undergoes forced liquidation, the proceeds from the sale are distributed by order of priority. Furthermore, all debt is placed higher than both preferred and common equity in the capital structure.
In effect, the relationship between default risk and equity holders is that an increase in the risk of default causes the cost of equity (i.e. the required rate of return by equity investors) to rise.
Why Does the Default Risk Premium Matter?
The default risk premium (DRP) is a core component in the pricing of debt instruments and a critical part of understanding the risk-return tradeoff in investing.
- Interest Rate Pricing → The default risk premium directly influences the cost of borrowing. The higher the default risk of a risky bond, the higher the interest rate that must be offered to incentivize investors.
- Investment Decision → From the perspective of an investor, the default risk premium guides investment decisions by comparing the default premium of comparable bonds. Based on the findings, the investor can determine the investment that provides a sufficient return that compensates for the higher risk of default, i.e. the most attractive risk-return trade-off.
- Credit Market Conditions → The default risk premium of securities can offer insights into the current state of the credit markets. For instance, if the default risk premium of a given sector (e.g. type of corporate bond issuers) is on the higher end relative to historical levels, the credit risk in the market signals deteriorating economic conditions.
- Monetary Policy → Central banks such as the U.S. Fed monitor the credit spreads and default risk premium as part of their monetary policy decision-making process. If the cost of borrowing seems too high from an outsized increase in the default risk premium, the central bank could potentially implement monetary policies to reduce the market interest rates.
Default Risk Premium Calculator
We’ll now move on to a modeling exercise, which you can access by filling out the form below.
Bond Default Risk Premium Calculation Example
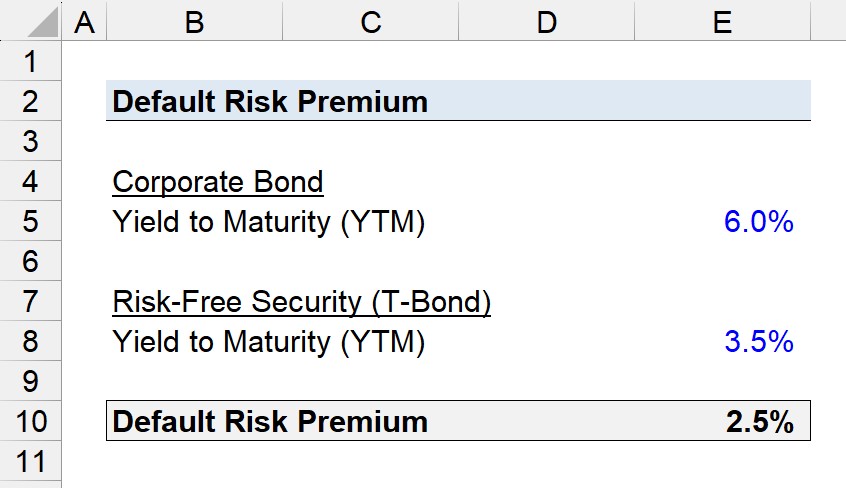
Suppose a corporate bond issuance has an expected yield to maturity (YTM) of 6.0%.
In contrast, a comparable U.S. Treasury bond has a yield of 3.5%.
- Corporate Bond, Yield to Maturity (YTM) = 6.0%
- U.S. T-Bond, Yield to Maturity (YTM) = 3.5%
The default risk premium is simply the difference between the yield on the corporate bond and the U.S. T-Bond, which comes out to 2.5%.
- Default Risk Premium (DRP) = 6.0% – 3.5% = 2.5%
In conclusion, the default risk premium (DRP) of 2.5% is the additional compensation required by investors in the market to purchase the corporate bond rather than the risk-free U.S. Treasury bond.

Everything You Need To Master Financial Modeling
Enroll in The Premium Package: Learn Financial Statement Modeling, DCF, M&A, LBO and Comps. The same training program used at top investment banks.
Enroll Today


