
What is Net Profit Margin?
The Net Profit Margin is a profitability ratio that measures the profit earned per dollar of revenue a company generates, expressed as a percentage.
The net profit margin reflects the percentage of a company’s revenue that is retained as net income (i.e. the “bottom line”).
How to Calculate Net Profit Margin?
The net profit margin is a profitability ratio that measures the percentage of earnings remaining once operating and non-operating costs have been deducted from the revenue generated by a company.
The net profit margin, expressed as a percentage, answers the following question: “How much profits is kept by the company for each dollar of revenue?”
For example, if a company’s net margin is 20%, $0.20 in net income is generated for each $1.00 of revenue.
The net margin calculation divides a company’s net income by the revenue in the corresponding period.
Both the revenue and net income of a company can be found on the company’s income statement, with the latter calculated as revenue after subtracting all expenses.
Illustrative Income Statement
- Net Revenue
- Less: Cost of Goods Sold (COGS)
- Gross Profit = Revenue – COGS
- Less: Operating Expenses (OpEx)
- Operating Income (EBIT) = Gross Profit – OpEx
- Less: Non-Operating Income / (Expenses)
- Pre-Tax Income (EBT) = EBIT – Non-Operating Expenses
- Less: Taxes
- Net Income = EBT –Taxes
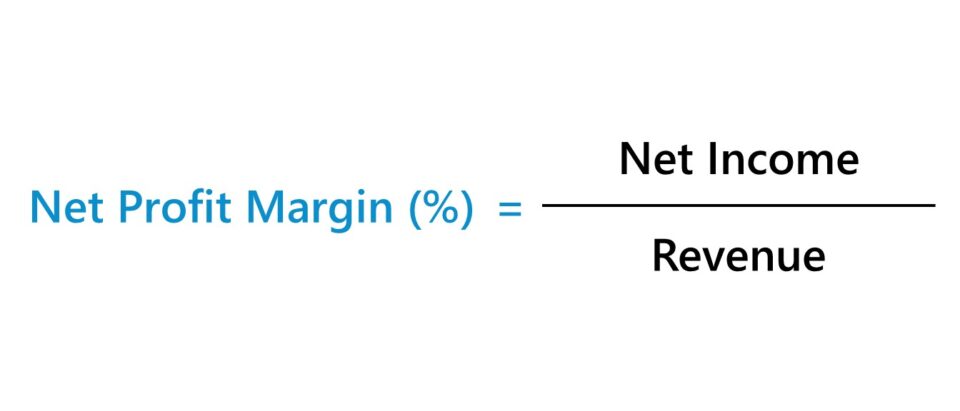
Net Profit Margin Formula
The net profit margin formula divides the net income of a company by the revenue generated in the coinciding period.
Where:
- Net Income → The “bottom line” of the income statement is net income, which measures a company’s post-tax earnings in a given period once all operating and non-operating expenses have been deducted.
- Revenue → The “top line” of the income statement is revenue, which is the total monetary value of goods and/or services sold (and “earned” per accrual accounting standards) by a company over a given period.
To convert the net margin from decimal notation to percentage form, multiply by 100.
What is a Good Net Profit Margin?
What a “good” net profit margin is will vary considerably by the industry, as well as the size and maturity of the companies under comparison.
As a general rule of thumb, net margins in excess of 10% are considered to be healthy, but the metric shouldn’t be taken at face value and requires more in-depth analysis, as our next section will explain.
Net income represents the accounting profits of a company, which means the metric is vulnerable to potential accounting manipulation and could show a misleading portrayal of profitability.
The concerns around the net margin stem from the shortcomings of accrual accounting (U.S. GAAP), namely the potential for discretionary management decisions that could skew earnings.
- Depreciation Expense and Useful Life Assumption of Acquired PP&E (Capex)
- Inventory Recognition Policies – i.e. Last in First Out (LIFO) vs. First in First Out (FIFO)
- Capital Structure (Capitalization) – i.e. Debt vs. Equity, Interest Expense
- Non-Operating Items – e.g. Interest Income, Sale of Assets, Inventory Write-Down, Goodwill Impairment
How to Interpret Net Profit Margin?
For example, a company’s net profit margin could be higher than its comparable peers due to the use of longer useful life assumptions for depreciating its fixed assets (PP&E), the lack of debt financing (i.e. resulting in lower or no interest expense), or operating in a state/country with more favorable tax structures.
Despite showing a higher net profit margin, the reality is that such differences are caused by non-operating factors, differences in accounting methods, and other discretionary decisions, rather than the company necessarily performing better than its peers.
The amount of debt on the balance sheet is one of the more significant considerations, as companies that opt to grow using debt financing rather than equity financing will incur higher interest expenses – which will effectively cause their net profit margin to decline.
Therefore, while higher net profit margins are typically perceived as positive signs, it is important to remember the limitations around the net income metric and accrual accounting.
With that said, net income is a poor metric for comparability due to the aforementioned pitfalls, which directly impact the reliability of the net profit margin metric as a point of comparison.
Learn More → Net Margin by Sector (Damodaran)
Net Profit Margin Calculator
We’ll now move to a modeling exercise, which you can access by filling out the form below.
1. Income Statement Assumptions
In the first section of our net profit margin modeling exercise, we’ll start with the income statement assumptions.
We’ll compare the net profit margins of three companies, with each having different financial assumptions.
Income Statement – Company A
- Revenue: $100m
- Cost of Goods Sold (COGS): –$40m
- Operating Expenses (OpEx): –$40m
- Interest Expense: –$10m
- Tax Rate: 30%
Income Statement – Company B
- Revenue: $100m
- Cost of Goods Sold (COGS): –$50m
- Operating Expenses (OpEx): –$30m
- Interest Expense: –$20m
- Tax Rate: 25%
Income Statement – Company C
- Revenue: $100m
- Cost of Goods Sold (COGS): –$30m
- Operating Expenses (OpEx): –$50m
- Interest Expense: $0m
- Tax Rate: 20%
Note that the operating profit margin – i.e. EBIT divided by revenue – is 20% in all three cases.
Different approaches towards depreciation of PP&E and other accounting decisions, such as inventory recognition (i.e. LIFO vs. FIFO) would be embedded within the COGS or OpEx line items.
However, the major differences in our example do not begin to emerge until the interest expense line item, which is just one example of a non-operating expense.
- Interest Expense, Company A = $10m
- Interest Expense, Company B = $20m
- Interest Expense, Company C = $0
The more debt a company holds on its balance sheet, the greater its interest expense will be – all else being equal.
In addition, the tax rate differs for each company, with Company A having the highest tax rate and Company C having the lowest tax rate.
2. Net Profit Margin Calculation Example
Once the stated assumptions have been entered, we are able to calculate the net income for each individual company:
- Net Income, Company A = $7m
- Net Income, Company B = $0m
- Net Income, Company C = $16m
Company C has the highest net income out of the three, with Company B at a break-even point (i.e. revenue = total expenses).
If we divide each net income figure by the revenue amount, we arrive at the net profit margin for all three companies.
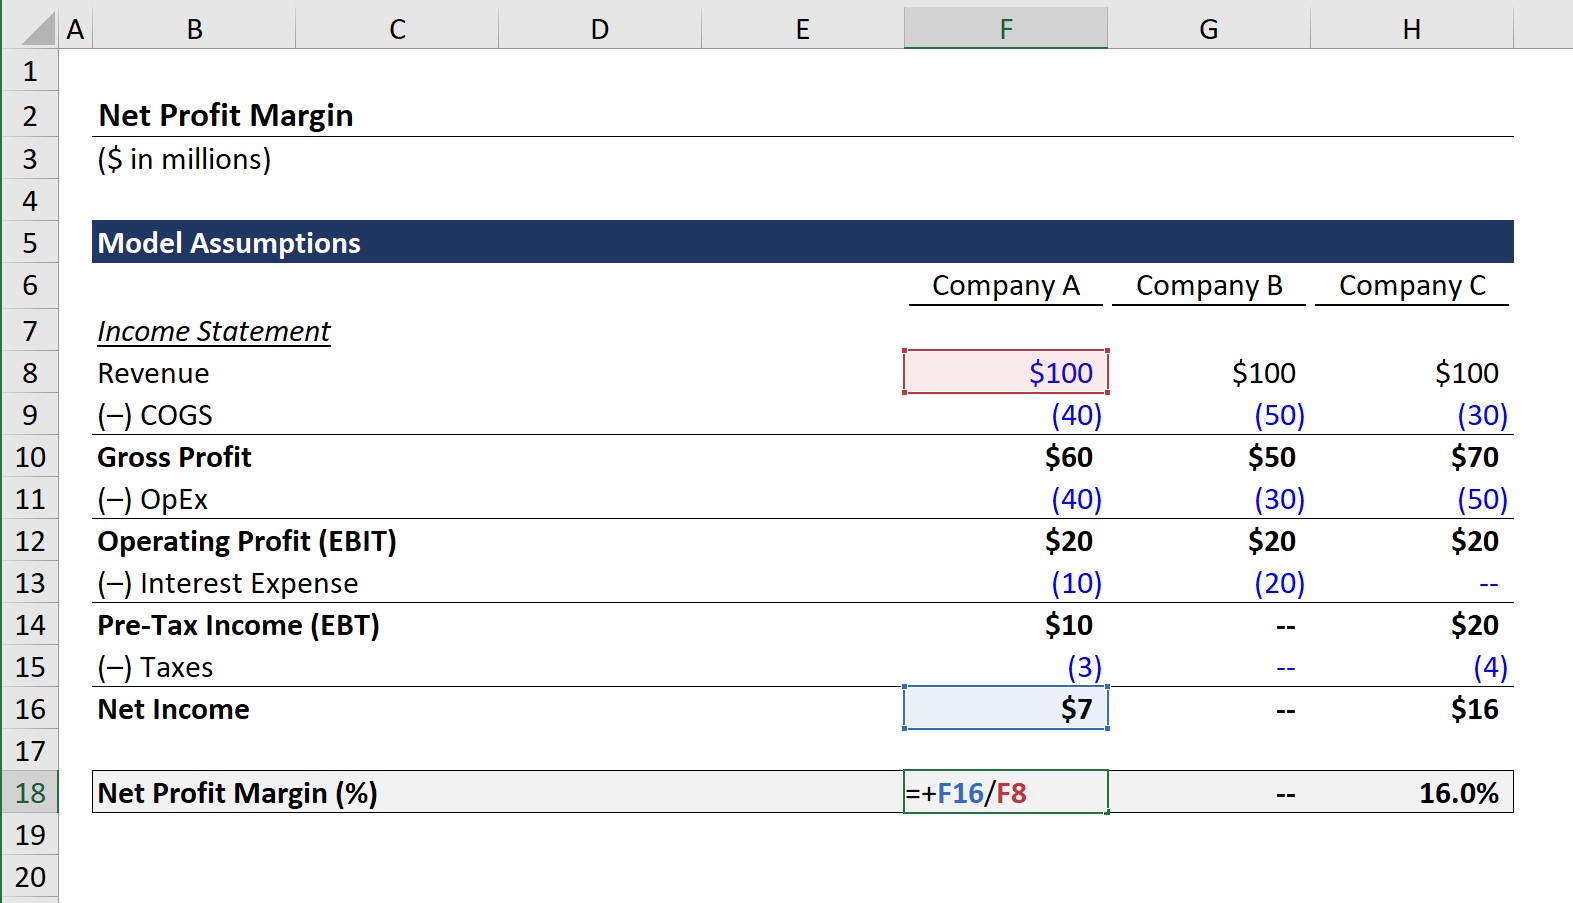
For instance, if we divide Company A’s net income by its revenue, we get the following:
- Net Profit Margin = $7m ÷ $100m =.07, or 7.0%
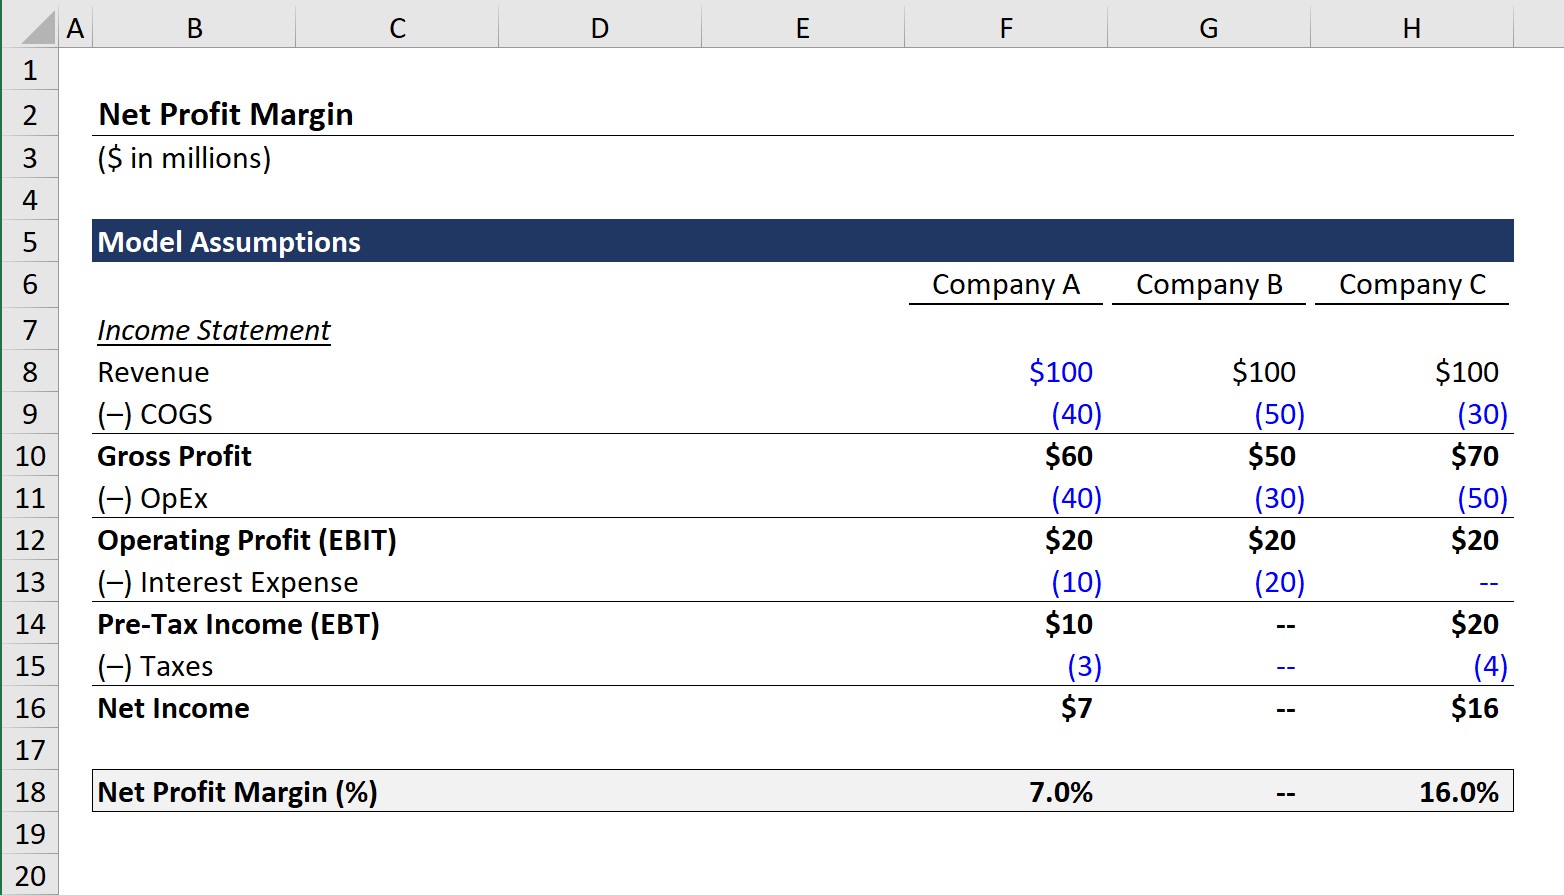
3. Net Profit Margin Ratio Analysis
The calculated net profit margins for each company are listed below.
- Company A – Net Profit Margin: 7.0%
- Company B – Net Profit Margin: 0.0%
- Company C – Net Profit Margin: 16.0%
If interpreted at face value, Company C seems to be the most efficient at running its operations and converting its net revenue into net income.
However, as opposed to being a sole function of operating profitability and efficiency at utilizing its assets, the differences between each company are, in fact, attributable to the inconsistencies in debt and tax jurisdictions.
In conclusion, our exercise demonstrates the shortcomings of the net profit margin, where management-specific accounting policies can misconstrue margins.
Therefore, further diligence must be performed on each company’s financial statements and fundamentals to determine which company is managed most efficiently from a profitability perspective.

Everything You Need To Master Financial Modeling
Enroll in The Premium Package: Learn Financial Statement Modeling, DCF, M&A, LBO and Comps. The same training program used at top investment banks.
Enroll Today
")
")


Both the revenue and net income of a company can be found on the company’s income statement, with the latter being calculated as revenue after subtracting all expenses.