
- What is Return on Equity?
- How to Calculate Return on Equity (ROE)
- Return on Equity Formula (ROE)
- What is a Good Return on Equity Ratio?
- What is the Conceptual Meaning of Return on Equity (ROE)?
- What are the Limitations of Return on Equity (ROE)?
- What are the Full-Form Components of Return on Equity (ROE)?
- ROE vs. ROA: What is the Difference?
- Return on Equity Calculator (ROE) | Excel Template
- 1. Operating Assumptions
- 2. Return on Equity Calculation Example (ROE)
- 3. ROE Ratio Analysis Example
What is Return on Equity?
Return on Equity (ROE) measures the net profits generated by a company based on each dollar of equity investment contributed by shareholders.
Typically expressed in percentage form, the ROE metric can be a very useful tool to gauge a management team’s capital allocation decisions and ability to drive shareholder value creation.
- The return on equity (ROE) is a financial ratio that measures the efficiency at which a company generates net profits per dollar of capital contributed by common shareholders.
- The return on equity, or ROE, is a method to determine if a company’s management can allocate equity capital into profitable projects that yield more earnings on behalf of equity shareholders.
- The formula to calculate the return on equity (ROE) ratio divides a company’s net income by the average balance of its book value of equity (BVE), i.e. the beginning and ending total shareholders' equity balance.
- The higher the return on equity (ROE) ratio, the better the company’s management is at converting its equity capital into net income (and vice versa).
How to Calculate Return on Equity (ROE)
The return on equity, or “ROE”, is a metric that represents how profitable the company has been, taking into account the contributions of its shareholders.
The ROE metric answers the question, “How much net profit is the company producing for each dollar invested by equity shareholders?”
Therefore, the return on equity (ROE) measure conveys the percentage of investor capital converted into net income on a dollar basis, which shows how efficiently the company handles the equity capital provided to them.
The process of calculating the return on equity (ROE) is relatively straightforward, as it divides net income by the average shareholders’ equity balance in the prior and current period.
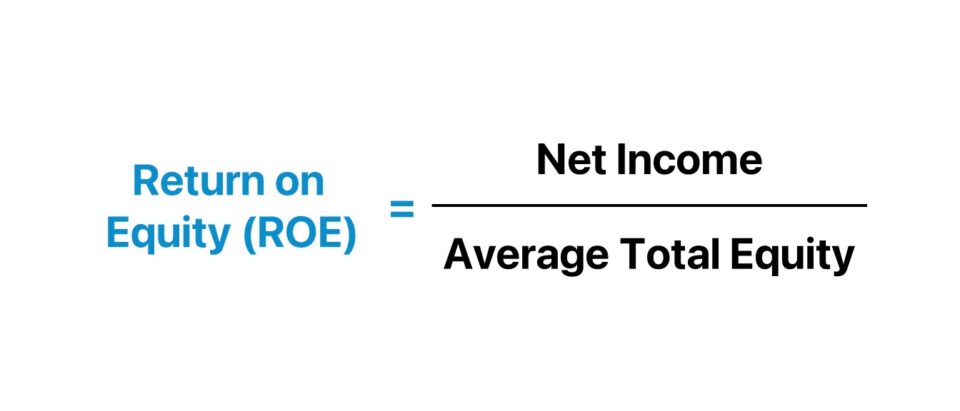
Return on Equity Formula (ROE)
The formula to calculate the return on equity (ROE) is as follows.
Where:
- Net Income → Often referred to as “net earnings”, net income represents the post-tax profits of the company and can be found at the bottom of the income statement – hence, it is often called the “bottom line”.
- Shareholders’ Equity → One of the three major components of the balance sheet, shareholders’ equity is the other funding source besides liabilities (i.e. debt).
Hypothetically, if all the assets belonging to the company were liquidated and used to pay off all outstanding liabilities, the remaining value would represent the shareholder’s equity, as the equity claims are at the bottom of the pecking order.
While the shareholders’ equity balance can be found directly on the balance sheet, it can also be calculated by subtracting the company’s liabilities from its assets.
However, shareholders’ equity is a book value measure of equity, not the equity value (i.e. market capitalization). Since shareholders’ equity is equal to a company’s total assets, less its total liabilities, ROE is often called the “return on net assets”.
The average net income is used in the formula because the income statement tracks a period of time (e.g. quarter, fiscal year), while the balance sheet is the outstanding balance of different types of line items at a particular point in time (i.e. a “snapshot”).
What is a Good Return on Equity Ratio?
The return on equity (ROE) metric provides useful insights into how efficiently existing and new equity invested into the company is being utilized.
- High Return on Equity (ROE): The higher the ROE ratio, the more the company gains in net profits with the proceeds provided by equity investors.
- Low Return on Equity (ROE): The lower the ROE ratio, the less the company is earning in net profits with the proceeds contributed by equity investors.
Over time, if the ROE of a company is steadily increasing, that is likely a positive signal that management is creating more positive value for shareholders.
Note that the net income value should be taken prior to any issuance of dividends to common shareholders, as those payments impact the return to common equity shareholders. Meanwhile, the preferred dividends, which receive debt-like treatments, should be deducted from net income.
While a higher ROE is nearly always perceived positively, peer comparisons must be made between comparable companies in the same or similar industry, followed by in-depth analysis to identify the real drivers of the value.
Learn More → Return on Equity (ROE) by Sector (Source: Damodaran)
What is the Conceptual Meaning of Return on Equity (ROE)?
In particular, the return on equity (ROE) is an important metric to track for existing and prospective investors, as they would want to confirm how efficiently a company can use its money to create income post-investment – and how reliable management’s decision-making is.
Companies with a higher return on equity (ROE) are far more likely to be profitable from the proper allocation of capital, but also because of the ability to raise capital from outside investors if needed.
The optionality to raise capital is applicable to all companies and a trait that investors seek in potential investments (and the management team). It represents proof of a company’s ability to efficiently use capital and execute thoughtful strategic decisions.
Therefore, the fact that the company requires fewer funds to produce more output can lead to more favorable terms, especially in early-stage companies and start-ups.
When investors provide capital to companies, they also invest in the ability of management to spend their capital on profitable projects without wasting the capital or using it for their own benefit.
What are the Limitations of Return on Equity (ROE)?
The return on equity (ROE) cannot be used as a standalone metric, as it is prone to be affected by discretionary management decisions and one-time events.
- Stock Buyback: For example, share buybacks could cause the shareholders’ equity balance to decrease – and the lower denominator can cause an “artificial” increase in ROE.
- Dividend Issuance: The issuance of dividends to preferred shareholders also has a similar impact, as preferred dividends come straight out of retained earnings and reduce the earnings retention rate.
- One-Time Item: One-time, non-recurring events can also cause ROE to be misleading, such as a significant inventory write-down. The result would be a lower net income from the expense recognized on the income statement, but only in the year the write-down is formally charged. The net impact of the write-down can cause the shareholders’ equity balance to fall, which offsets the expense and creates the false illusion that there have been improvements in the company’s return to shareholders.
There are many reasons why a company’s ROE may beat the historical average or fall short of it. For that reason, investors often look at complementary metrics, such as ROIC, to help understand the full picture of the business.
What are the Full-Form Components of Return on Equity (ROE)?
The return on equity (ROE) formula – once broken down further into its full-form components – can be segmented into three distinct parts:
- Net Profit Margin = Net Income ÷ Sales
- Return on Assets (ROA) = Net Income ÷ Total Assets
- Financial Leverage = Total Assets ÷ Common Equity
One noteworthy consideration of the return on equity (ROE) metric is that the issuance of debt capital is not reflected since only equity is captured in the metric.
In effect, whether a company has excessive debt on its B/S, is opting to raise risky debt rather than equity, or generates more profits using funds from debt lenders is not reflected in the ROE metric.
Instead, one could easily misinterpret an increasing ROE, as the company produces more profits using less equity capital, without seeing the full picture (i.e. reliance on debt).
The more debt a company has raised, the less equity it has in proportion, which causes the ROE ratio to increase.
If there is an all-equity financed company, its ROE and ROA will be equal – i.e. the balance sheet equation states that “Assets = Liabilities + Shareholders’ Equity”.
But if the company raised debt for the first time, the net impact would be a positive increase to ROE (i.e. ROE > ROA) due to the increased cash balance, which causes the total assets side to rise.
The Wharton Online & Wall Street Prep Applied Value Investing Certificate Program
Learn how institutional investors identify high-potential undervalued stocks. Enrollment is open for the Feb. 10 - Apr. 6 cohort.
Enroll TodayROE vs. ROA: What is the Difference?
The difference between return on equity (ROE) and return on assets (ROA) is tied to the capital structure, i.e. the mixture of debt and equity financing used to fund operations.
To provide a brief example showing how leverage (debt) can cause ROE to be misleading, imagine there are two companies (Company A and Company B) with the same amount of assets and net income but different capital structures.
Both companies have $1bn in total assets and $240m in net income.
- Company A → The first company has $400m in total debt and $600m in average shareholders’ equity ($1bn – $400m).
- Company B → The second company has $200m in total debt and $800m in average shareholders’ equity ($1bn – $200m).
Company A has an ROE of 40% ($240m ÷ $600m), but Company B has an ROE of 30% ($240m ÷ $800m), with the lower ROE % being due to the 2nd company carrying less debt on its B/S.
To elaborate, Company A shows a higher ROE, but this is due to its higher debt, not greater operating efficiency. In fact, the company with the higher ROE might even suffer too much of a debt burden that is unsustainable and could lead to a potential default on debt obligations.
Return on Equity Calculator (ROE) | Excel Template
We’ll now move to a modeling exercise, which you can access by filling out the form below.
1. Operating Assumptions
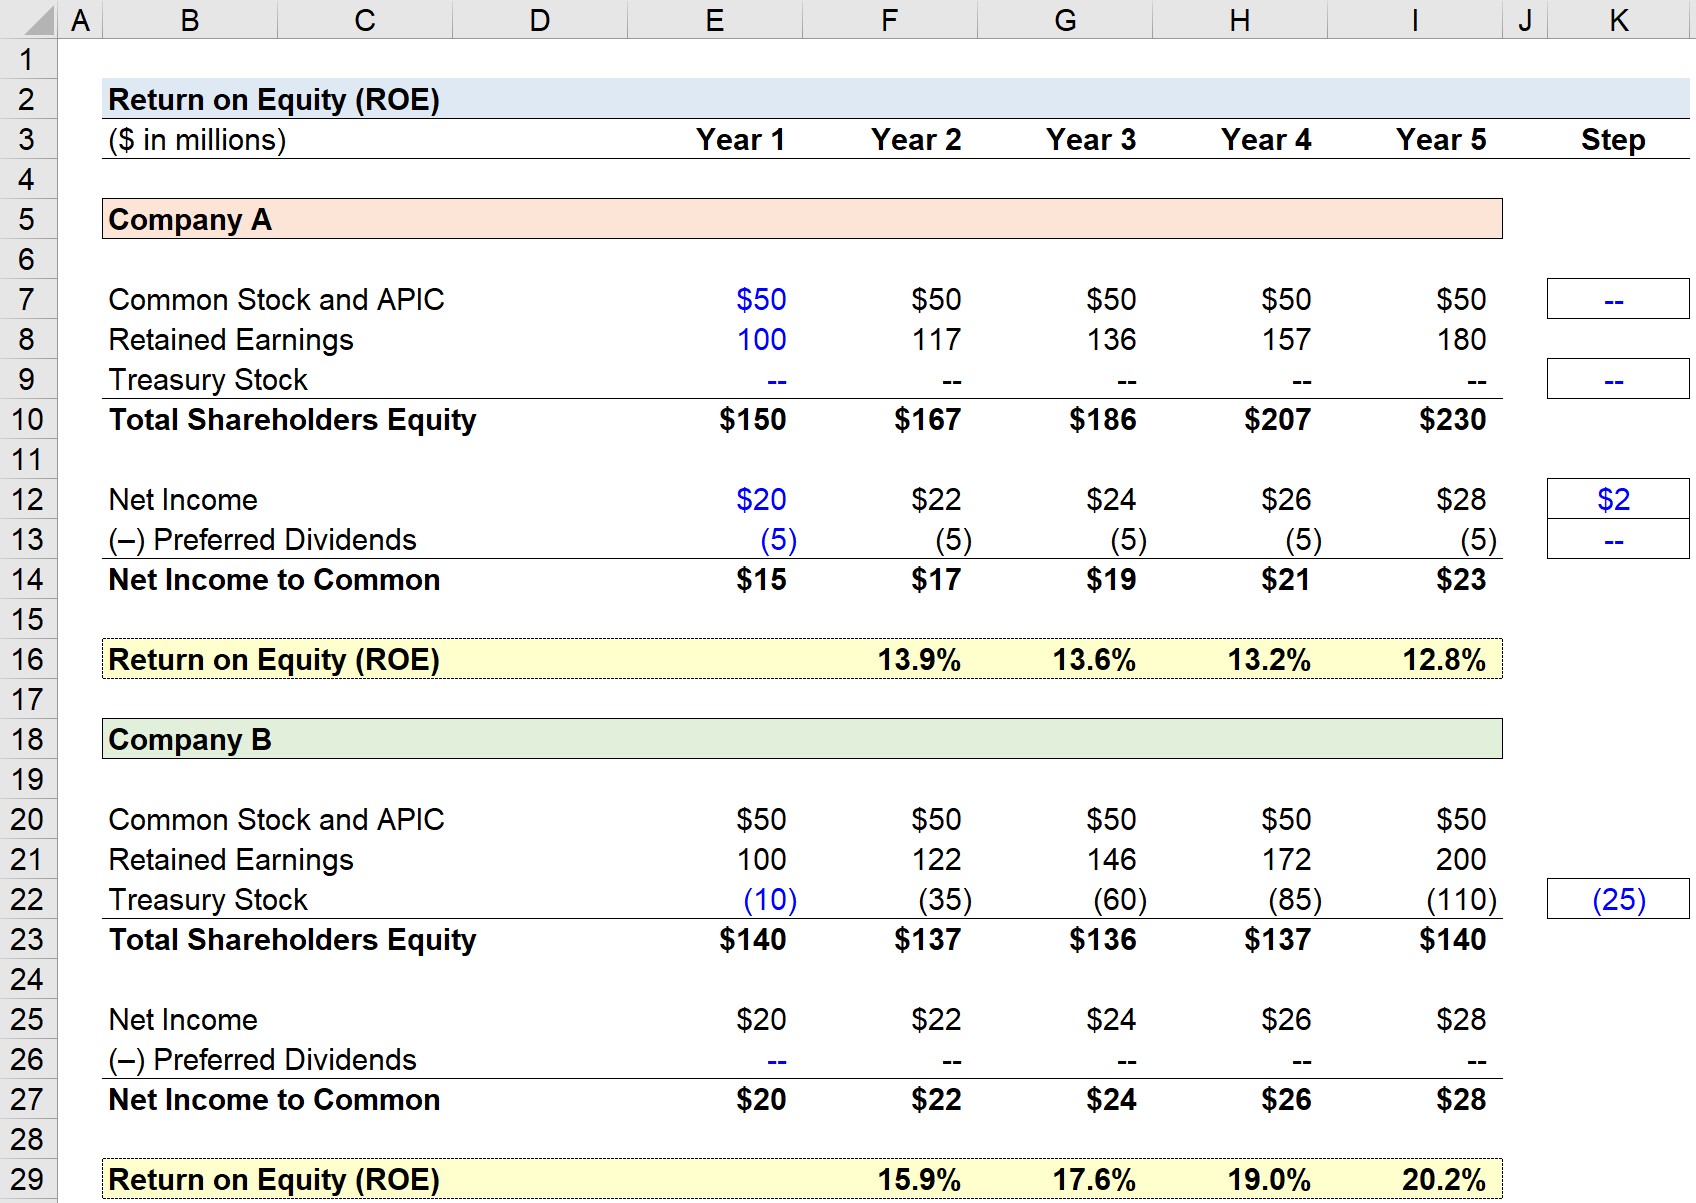
In our modeling exercise, we’ll calculate the return on equity (ROE) for two different companies, Company A and Company B.
The two companies have virtually identical financials, with the following shared operating values listed below.
- Common Stock and APIC = $50 million
- Retained Earnings = $100 million
- Net Income = $20 million
Each year, net income is growing by $2m for both companies, so net income reaches $28m by the end of the forecast in Year 5.
However, the differences that cause the ROE of the two companies to diverge are related to discretionary corporate decisions.
- Preferred Dividend Issuance → Company A issues $5m in preferred dividends each year.
- Stock Buyback → Company B repurchases $25m of its shares each year.
2. Return on Equity Calculation Example (ROE)
In the final step, we’ll calculate the return on equity (ROE) by dividing the “Net Income to Common” line item by the average between the prior and current period “Total Shareholders’ Equity”.
The issuance of $5m in preferred dividends by Company A decreases the net income attributable to common shareholders.
Company A’s ROE declines from 13.9% to 12.8% from Year 1 to Year 5.
Across the same time span, Company B’s ROE increased from 15.9% to 20.2%, despite the fact that the amount of net income generated was the same amount.
Given the decision by Company B to repurchase $25m worth of shares each year, which is captured in the “Treasury Stock” line item as a contra-equity account, the total shareholders’ equity is lower compared to Company A.
By the end of Year 5, the total amount of shares bought back by Company B has reached $110m. And the “Total Shareholders’ Equity” account balance is $230m for Company A, but $140m for Company B.
In effect, the “Net Income to Common” for Company A in Year 5 is $23m while it is $28m for Company B in the same period.
3. ROE Ratio Analysis Example
In conclusion, the ROE metric can be an informative metric for investors in assessing management’s ability to efficiently use investor capital to achieve excess profits (and increased returns).
Higher ROE metrics relative to comparable companies imply increased value creation using less equity capital, which is precisely what equity investors pursue when evaluating investments.
However, the return on equity (ROE) metric should not be used as a standalone metric due to its many drawbacks.
Corporate capital allocation decisions unrelated to core operations (e.g. preferred dividends, share repurchases) can significantly impact the ROE. Therefore, ROE should be used in conjunction with other metrics such as ROA, ROIC, and EPS growth to evaluate the actual financial health of a company.
")
")

