
- What is ROIC?
- How to Calculate ROIC
- ROIC Formula
- ROIC Example
- What is Invested Capital in ROIC?
- What is a Good ROIC Ratio?
- ROIC vs. ROCE: What is the Difference?
- ROIC vs. WACC: What is the Difference?
- What are the Full-Form ROIC Components?
- How to Analyze ROIC and Growth
- How to Balance ROIC with Growth and Value Creation
- ROIC Calculator
- 1. NOPAT Calculation Example
- 2. Invested Capital Calculation Example
- 3. ROIC Calculation Example
What is ROIC?
The Return on Invested Capital (ROIC) measures the percentage return of profitability earned by a company using the capital contributed by equity and debt providers.
Conceptually, the return on invested capital (ROIC) is a measure of value creation. In practice, ROIC is commonly used to determine the efficiency at which capital is allocated because the consistent generation of a positive value is perceived positively as a necessary attribute of a quality business.
- ROIC stands for “Return on Invested Capital” and measures the efficiency at which a company can spend the capital contributed by shareholders and lenders to generate returns.
- The ROIC is a profitability ratio that measures the efficiency at which a company's management can allocate capital, which ultimately determines the long-term sustainability of the business model.
- The ROIC is the rate of return earned by a company from reinvesting the funds contributed by its capital providers, i.e. equity and debt investors.
- The formula to calculate ROIC is NOPAT divided by the average invested capital, i.e. the company's fixed assets and net working capital (NWC).
How to Calculate ROIC
ROIC, or “Return on Invested Capital”, represents the efficiency at which a company uses its capital to generate profitable returns on behalf of its shareholders and debt lenders.
Fundamentally, the return on invested capital (ROIC) answers the question, “How much in returns is the company earning per dollar of invested capital?”
Therefore, the ROIC concept reflects the rate of return generated by a company using the funds contributed by its capital providers.
Since the return metric is presented in the form of a percentage, the metric can be used to assess a company’s profitability as well as make comparisons to peer companies.
For companies attempting to raise capital from outside investors for the first time or raise additional funding, the ROIC is a critical KPI that can serve as validation (i.e. a track record of “proof”) that management is competent and can be relied upon to pursue and capitalize on profitable opportunities.
The return on invested capital (ROIC) calculation comprises the following steps:
- Step 1 ➝ Compute NOPAT (or EBIAT)
- Step 2 ➝ Calculate Average Invested Capital (IC)
- Step 3 ➝ Divide NOPAT by Average Invested Capital
ROIC Formula
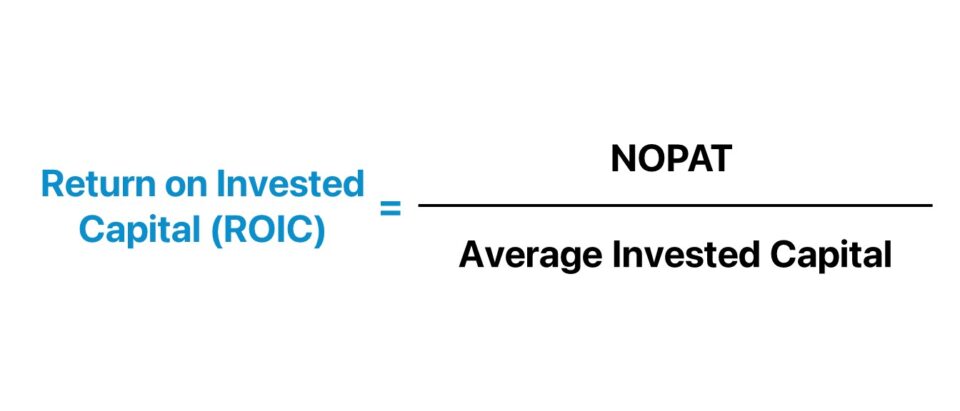
The formula used to calculate ROIC is the ratio between net operating profit after tax (NOPAT) and average invested capital (IC).
Where:
- Net Operating Profit After Tax (NOPAT) ➝ NOPAT is used in the numerator because the cash flow metric captures the recurring core operating profits and is an unlevered measure (i.e. unaffected by the capital structure). Unlike metrics such as net income, NOPAT is a company’s tax-affected operating profit (EBIT) and thus represents what is available for all equity and debt providers.
- Invested Capital (IC) ➝ As for the denominator, the invested capital represents the sources of funding raised to grow the company and run the day-to-day operations.
The ROIC ratio quantifies the profits that the company can generate for each dollar of capital invested in the company in a percentage.
The two common sources of funds for companies that are used to invest in cash flow generative assets and derive economic benefits are debt and equity.
- Debt Financing ➝ The capital obtained by a company in exchange for the obligation to pay periodic interest expense throughout the borrowing term and the return on the original principal at maturity.
- Equity Financing ➝ The capital raised by a company by issuing ownership stakes, i.e. shares representing partial ownership, to institutional investors such as venture capital or growth equity firms, or the secondary markets if the company is publicly traded.
ROIC Example
Suppose a company generated $10 million in NOPAT in Year 1 and invested an average of $100 million from the end of Year 0 to the end of Year 1.
- NOPAT = $10 million
- Average Invested Capital (IC) = $100 million
Given the NOPAT and average invested capital, the ROIC comes out to 10%.
- Return on Invested Capital (ROIC) = $10 million ÷ $100 million = 10.0%
The 10% ROIC implies that the company generates $10 of net earnings per $100 invested in the company.
What is Invested Capital in ROIC?
The two core components of the ROIC calculation are NOPAT and invested capital.
- NOPAT ➝ NOPAT, or “EBIAT,” is the tax-affected operating income (EBIT) of the company
- Invested Capital (IC) ➝ Invested capital, on the other hand, is the sum of fixed assets, net working capital (NWC), and acquired intangibles, including goodwill.
The formula to calculate NOPAT and invested capital is as follows.
- NOPAT = EBIT × (1 – Tax Rate %)
- Invested Capital = Fixed Assets + Net Working Capital (NWC) + Acquired Intangibles + Goodwill
The calculation of NOPAT is relatively straightforward since EBIT (or “operating income”) is taxed as if there is no debt in the company’s capital structure (and, thus, no interest expense).
In contrast, invested capital (IC) can become a rather onerous calculation.
There are two routes to think about invested capital, but either approach is ultimately identical to the other due to double-entry accounting.
- Net Working Capital (NWC) ➝ The net assets that a business needs to continue operating day-to-day.
- Capital Expenditure (Capex) ➝ The funding provided by creditors and shareholders to finance the purchase of the company’s assets, which can be categorized as either growth or maintenance capex.
The alternative, simpler method of calculating invested capital is to calculate net debt—which is equal to gross debt subtracted by cash and cash equivalents—and add net debt to equity from the balance sheet.
- Cash and Cash Equivalents ➝ Since cash and cash equivalents (e.g. marketable securities) are not operating assets, the line item is thus excluded. Cash is considered to be “sitting idle” on the B/S and is thus not part of the core operations of a company.
- Debt and Interest-Bearing Securities ➝ A similar logic is applied to debt and interest-bearing securities, which are not considered operating liabilities, either. Hence, the appropriate treatment of those sorts of borrowings is to ignore them in the computation.
The complications with invested capital (IC) arise for intangible-intensive industries, in which the intangible assets belonging to the companies that operate in the industry are not recognized yet.
While the inclusion of acquired intangibles and goodwill – the premium paid in excess of the fair value of the acquired assets – is intuitive since such corporate actions reflect the capital allocation of management (i.e. the decision to pay a premium counts), the value attributable to unacquired intangible assets is far more challenging.
One method is to capitalize intangible investments—i.e. the incurred research and development (R&D) expense—but the issue is that the subjective adjustments make the ROIC metric less reliable as a measure of comparability.
Why? There is less standardization, and the comparisons can easily become distorted from the discretionary adjustments.
What is a Good ROIC Ratio?
The return on invested capital (ROIC) is one method to determine whether or not a company has a defensible economic moat.
The term “moat” refers to a sustainable competitive advantage belonging to a particular business that protects its long-term profit margins and market share from new market entrants (and other external threats) over the long run.
The overall objective of calculating the metric is to grasp a better understanding of how efficiently a company has been utilizing its operating capital (i.e. capital deployment).
For investors in the public markets, the metric is frequently used to screen for potential investments, not just for retail investors but for institutional investors such as hedge funds – especially funds utilizing long-only, value-oriented strategies.
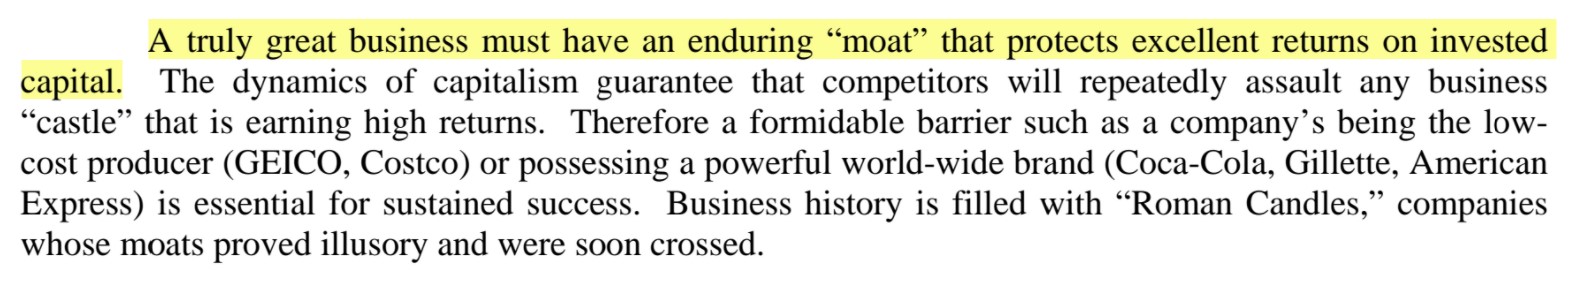
Warren Buffett Quote on Economic Moats (Source: 2007 Berkshire Hathaway Shareholder Letter)
Finding public companies in the stock market with an actual “moat” and consistently above-market ROICs is, without a doubt, easier said than done, but one that can yield high investment returns.
The reason the ROIC concept tends to be prioritized by value investors is that most investors purchase shares under the mindset of a long-term holding period.
Hence, current earnings and cash flows are a relatively small component of the total net return. Instead, the ability to reinvest those earnings to build real value is much more important.
The Wharton Online & Wall Street Prep Applied Value Investing Certificate Program
Learn how institutional investors identify high-potential undervalued stocks. Enrollment is open for the Feb. 10 - Apr. 6 cohort.
Enroll TodayROIC vs. ROCE: What is the Difference?
The return on invested capital (ROIC) and return on capital employed (ROCE) are returns-based metrics used to analyze the profitability of a company and the efficiency at which its management team allocates capital.
- Return on Invested Capital (ROIC) ➝ The distinction between ROIC and ROCE is that the numerator in the ROIC formula is NOPAT, whereas the denominator is invested capital.
- Return on Capital Employed (ROCE) ➝ On the other hand, the numerator in ROCE is also NOPAT, but the denominator is capital employed.
Where:
- Capital Employed = Total Assets – Current Liabilities
Therefore, ROIC and ROCE offer different perspectives on a company’s operating efficiency and capital allocation.
ROIC vs. WACC: What is the Difference?
One common way to use ROIC as an investment decision-making tool is to compare the investment’s ROIC to its weighted average cost of capital (WACC).
Comparing the ROIC to the WACC can help decide whether the company creates sufficient value for its stakeholders.
If the ROIC is higher than the WACC, that means the company creates positive value, whereas if the ROIC is lower than the WACC, that means the company’s value is declining.
- If ROIC > WACC → “Invest”
- If ROIC < WACC → “Pass”
Companies that generate an ROIC above their cost of capital imply that the management team can allocate capital efficiently and invest in profitable projects, which is a competitive advantage in itself.
When investors screen for potential investments, the minimum ROIC tends to be set between 10% and 15%, but that threshold will be firm-specific and will depend on the type of strategy employed.
One of the more frequent use cases of tracking the metric is for evaluating the judgment of the management team regarding capital allocation.
Namely, there are five methods for corporations to improve their ROIC and thus create positive economic value over the long run:
- Invest in High Return, Profitable Projects ➝ ROIC > WACC (“Value Creating”)
- Improve Capital Efficiency ➝ Higher Asset Turnover, Higher Inventory Turnover, Revenue Maximization
- Implement Operating Improvements ➝ Higher Profit Margins, Reduce Unnecessary Spending
- Optimize Capital Structure ➝ Potentially Lower WACC from Issuance of Debt
- Identify and End “Value Destroying” Projects ➝ NPV < 0
Learn More → ROIC by Sector (Source: Damodaran)
What are the Full-Form ROIC Components?
From the expanded full-form formula of ROIC, we can see the value is the product of:
- Invested Capital Turnover ➝ “How much revenue does each dollar of invested capital generate?”
- Margins (%) ➝ “How much profits are retained after deducting the cost of goods sold (COGS) and operating expenses (OpEx) to arrive at operating income (EBIT), which is then tax-affected?”
The underlying components of the ROIC metric, at its core, are reflected in the following equation.
NWC affects invested capital since if operating assets increase, invested capital increases as well – which in turn decreases the metric (i.e. more spending is needed to sustain or increase growth).
Conversely, if operating liabilities were to increase, ROIC would increase because NWC is lower.
A higher return on invested capital (ROIC) can be considered an indication that a company is required to spend less to generate more profit.
- Profitable Return on Invested Capital → Positive Value Creation and Shareholder Returns
The higher the profit margins of the company, the higher the return on invested capital, as the company can convert more revenue into profits, or NOPAT, to be more specific.
How to Analyze ROIC and Growth
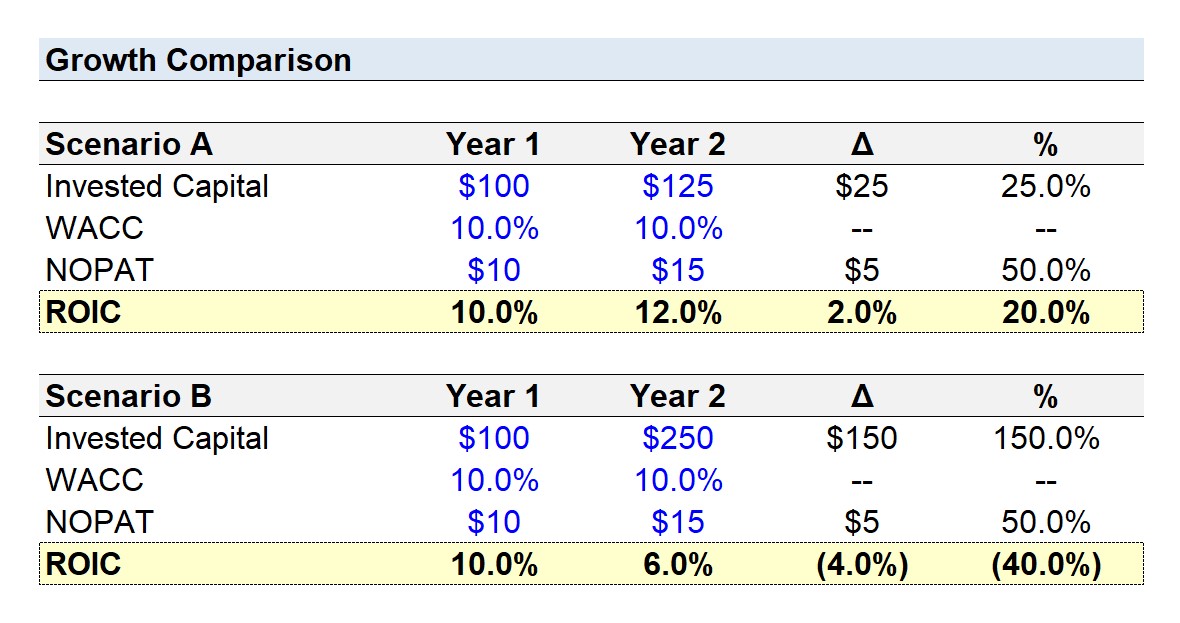
Contrary to a common misunderstanding, growth is not always a positive signal for a company.
The question that must be asked is, “At what cost was the growth obtained?”
Often, companies will make significant investments to expand, but if the ROIC is lower than the cost of capital (WACC), the Capex destroys value, not creating shareholder value.
- Scenario A ➝ In Scenario A, the change in invested capital was $25m more, for an increase of $5m in NOPAT.
- Scenario B ➝ In contrast, in Scenario B, the NOPAT increased by $5m too, but $150m was spent. Therefore, focusing on growth in NOPAT by itself would be misleading in the latter case.
How to Balance ROIC with Growth and Value Creation
Generally speaking, the higher the return on invested capital (ROIC), the more likely the company is to achieve sustainable long-term value creation.
- 50% ROIC ➝ A 50% ROIC means that a company provided with $1.00 in funding can reinvest those proceeds to turn the investment into $1.50.
- 25% ROIC ➝ In comparison, a 25% ROIC means that the company turned the $1.00 into $1.25 instead, so it should be straightforward to understand that a higher ROIC ratio is preferable.
Companies with higher return on invested capital (ROIC) are more likely to continue employing capital thoughtfully to achieve returns in line with the past (or similar) – albeit, identifying such opportunities early on is easier said than done.
Growth can often be the most enticing factor to investors—whether investing in the public equities or private markets— but a consistent return on invested capital (ROIC) is a more sustainable pathway to long-term value creation.
On that note, value investors in particular prioritize investing in the equity of companies led by a management team that can efficiently allocate capital toward projects that create long-term, sustainable value.
ROIC Calculator
We’ll now move on to a modeling exercise, which you can access by filling out the form below.
1. NOPAT Calculation Example
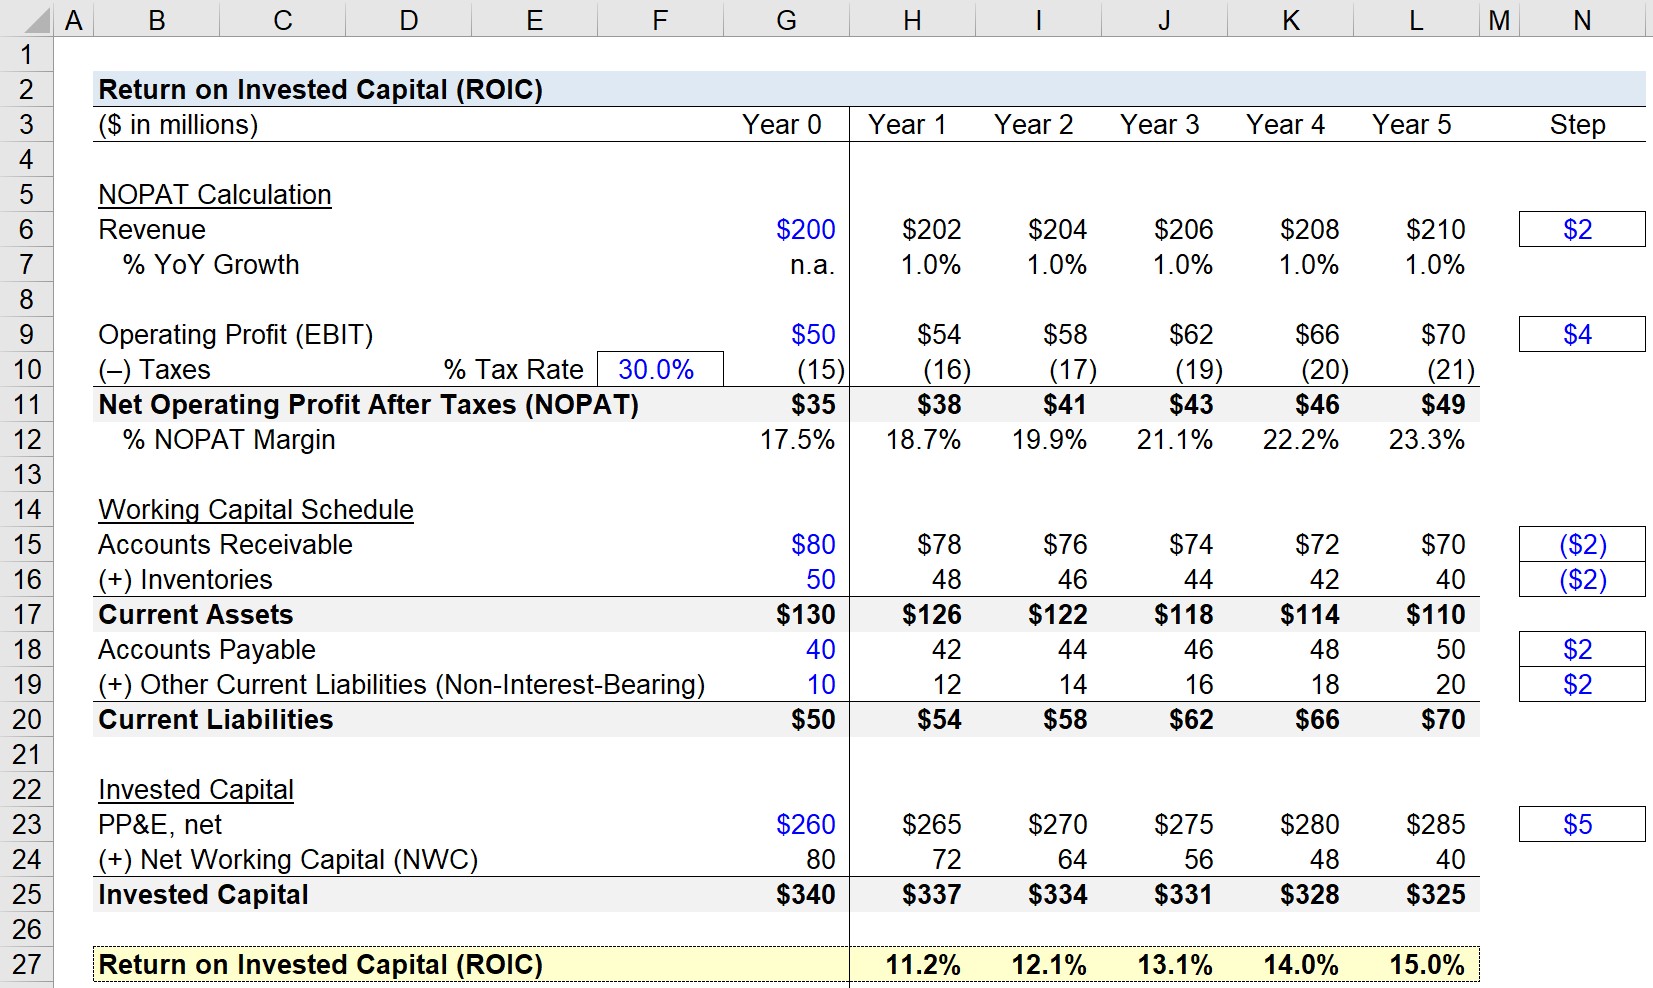
Suppose we’re tasked with calculating the return on invested capital (ROIC) of a company with the following financial profile as of Year 0.
- Year 0 Revenue = $200 million
- Year 0 Operating Income (EBIT) = $50 million
- Tax Rate = 30%
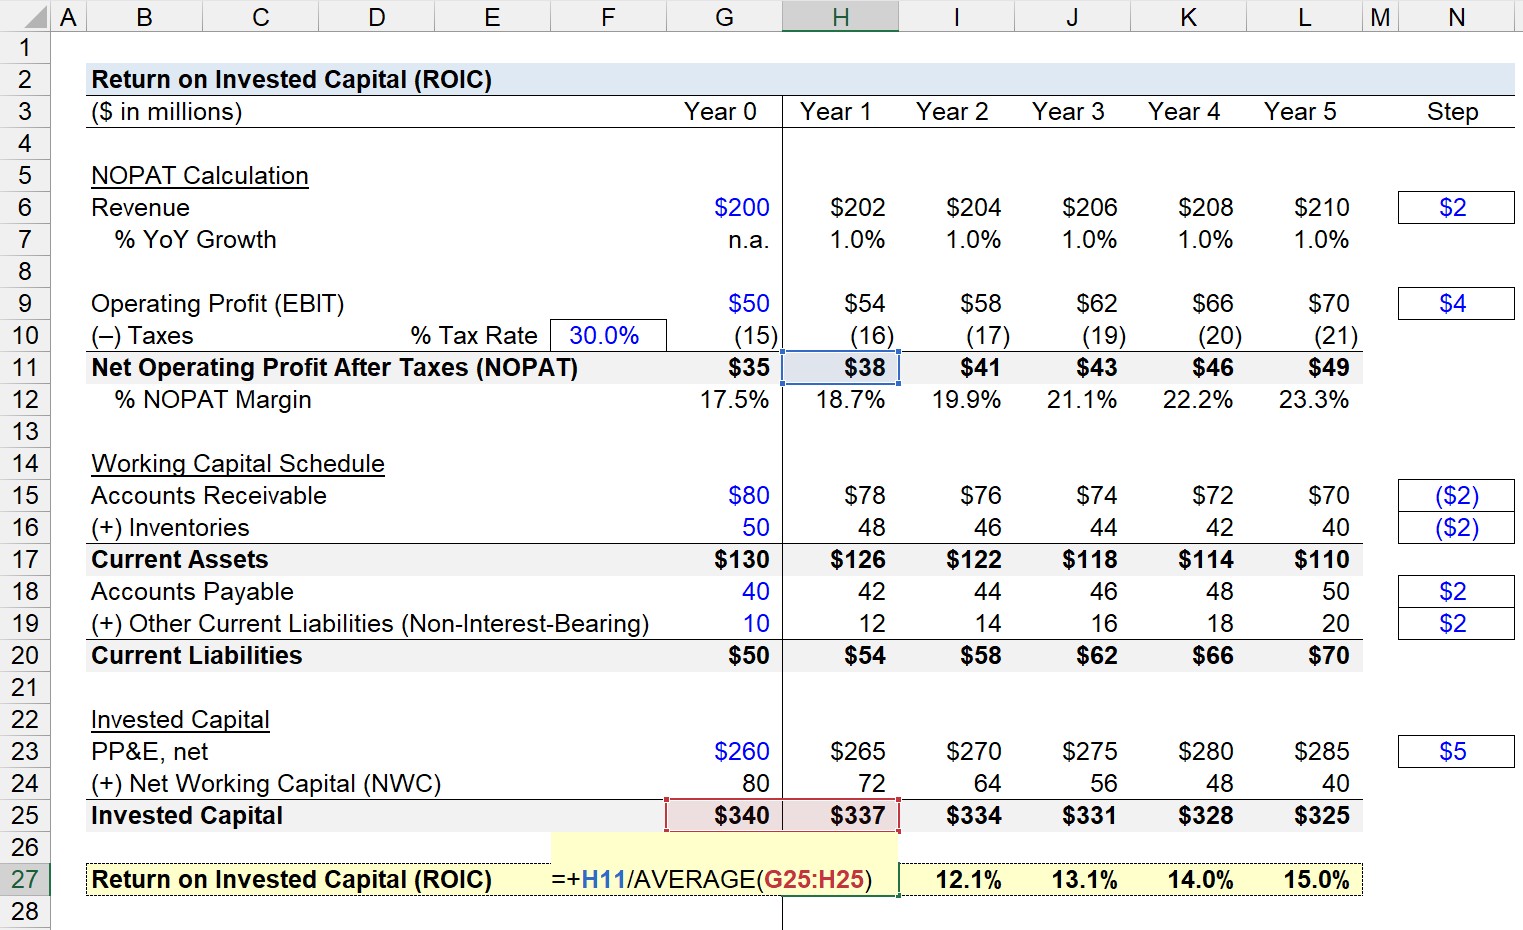
From Year 0 to Year 5, revenue is projected to grow $2m per year, while EBIT grows $4m per year under the same time horizon. To reflect this, we’ll use step functions as seen on the right side of the model.
The NOPAT margin – NOPAT as a percentage of revenue – expanded from 17.5% in Year 0 to 23.3% in Year 5.
Based on these assumptions, note that the growth of NOPAT is outpacing revenue, which will increase the likelihood of ROIC increasing – unless the invested capital offsets the margin expansion.
2. Invested Capital Calculation Example
Next, we’ll calculate the invested capital, which represents the net operating assets used to generate cash flow.
For the working capital schedule and fixed assets forecast, the following assumptions will be used:
- Accounts Receivable (A/R) = $80 million
- Inventories = $50 million
- Accounts Payable (A/P) = $40 million
- Other Current Liabilities = $10 million
- PP&E = $260 million
The company’s net working capital (NWC) can be calculated by subtracting the current liabilities (excluding debt and interest-bearing securities) from the current assets (excluding cash & cash equivalents).
All operating current assets are projected to decline by $2m each year, while operating current liabilities are forecast to grow by $2m each year.
The PP&E balance is forecast to grow by $5m each year.
3. ROIC Calculation Example
Once the entire forecast is complete, we can calculate the ROIC in each period by dividing NOPAT by the average between the current and prior period invested capital balance.
Starting from Year 1 to Year 5, we can see an increase from 11.2% to 15.0%, which is caused by increased profit margins and the increase in operating current liabilities.
- ROIC – Year 1 = $38 million ÷ ($340 million + $337 million) = 11.2%
Since the invested capital is declining while the revenue and NOPAT are growing at a higher pace, the ROIC is rising because more value is being derived from the invested capital.
The takeaway here is that the more revenue generated per dollar of invested capital and the higher the profit margins, the higher the return on invested capital (ROIC) will be — all else being equal.
In the final step, we multiply the NOPAT margin by the average invested capital balance of the current and prior year to get the same ROICs, which confirms our calculations were done correctly.
")
")
")
")
Does financial asset like loan to subsidiary or associate and loan to employee will be termed as invested capital ?
Plus why goodwill come under invested capital for roic calculation when it does not create any return, is it not just an accounting adjustment?
Hi Brad, Are the goodwill and deferred tax asset / liability counted as operating assets / operating liability? Are they inclusive in invested capital? I believe operating asset and invested capital (NWC and fixed asset) are two distinct concepts, operating asset is a more broader concept, there are assets that… Read more »
Do operating leases count as fixed assets?