
What is EV/EBITDA?
The EV/EBITDA Multiple compares the total value of a company’s operations (EV) relative to its earnings before interest, taxes, depreciation, and amortization (EBITDA).
In practice, the EV/EBITDA multiple is often used in relative valuation (i.e. “comps analysis”) to compare different companies in the same or an adjacent sector.
How to Calculate EV/EBITDA Multiple?
The enterprise value represents the debt-inclusive value of a company’s operations (i.e. unlevered) while EBITDA is also a capital structure-neutral cash flow metric.
Conceptually, the EV/EBITDA multiple answers the question, “For each dollar of EBITDA generated by a company, how much are investors currently willing to pay?”
The EV-to-EBITDA multiple is the ratio between enterprise value and EBITDA.
- Enterprise Value (EV) → The numerator, the enterprise value, calculates the value of a company’s operations, i.e. how much the company’s operations are worth from the perspective of all stakeholders, such as debt lenders and common shareholders.
- EBITDA → EBITDA stands for “earnings before interest, taxes, depreciation, and amortization”, and is a widely used proxy for a company’s core operating cash flows (i.e. unlevered).
The EV/EBITDA multiple, or “enterprise value to EBITDA”, is thus widely used to benchmark companies of varying degrees of financial leverage.
- Enterprise Value Multiple: Since EV/EBITDA is categorized as an enterprise value multiple, ensure that the numerator and denominator represent the same investor groups – which in this case, is all investor groups (e.g. common and preferred equity shareholders, debt lenders). In other words, cash flows must pertain to all providers of capital. For example, interest expense must NOT be deducted from the cash flow metric used here, as it is specific to one investor group, the lenders.
- Equity Value Multiple: Unlike a levered valuation multiple such as the price to earnings ratio (P/E ratio), the EV/EBITDA multiple accounts for the debt sitting on a company’s balance sheet. Therefore, the EV/EBITDA multiple is often used to value potential acquisition targets in M&A because it quantifies the amount of debt that the acquirer must assume (i.e. cash-free, debt-free).
If there are two virtually identical companies with their leverage ratios consisting of the sole difference (i.e. percentage of debt in the total capitalization), you’d expect the two EV/EBITDA multiples to be similar.
While these two companies are very unlikely to be the same, in theory, the enterprise value and EBITDA metrics are each independent of capital structure decisions, and thus it makes sense that they would have similar EV/EBITDA multiples.
The process of calculating the EV/EBITDA multiple can be broken into three steps:
- Calculate Enterprise Value → Equity Value + Net Debt
- Calculate EBITDA → EBIT + D&A
- Divide Enterprise Value by EBITDA
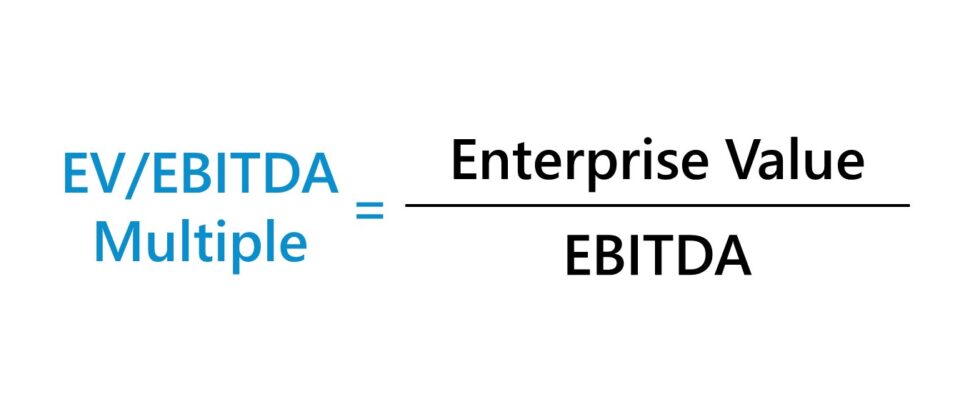
EV/EBITDA Formula
The formula for calculating the EV/EBITDA multiple is as follows.
At their simplest, the two metrics can be calculated using the following formulas:
What is a Good EV/EBITDA Ratio?
Generally, the lower the EV to EBITDA ratio, the more attractive the company may be as a potential investment.
- Lower EV to EBITDA Ratio → Potentially Undervalued by Market
- Higher EV to EBITDA Ratio: → Potentially Overvalued by Market
However, there are no set rules on what determines a low or high EV/EBITDA valuation multiple because the answer is contingent on the industry that the target company operates within.
For example, an EV/EBITDA multiple of 10.0x could be viewed as being on the higher end for a consumer goods company. However, a software company valued at 10.0x may even be on the lower end of the valuation range commonly found in the software industry.
Therefore, interpretations of valuation multiples are all relative and require more in-depth analyses before making a subjective decision on whether a company is undervalued, fairly valued, or overvalued.
Additionally, for that reason, comparisons of a company’s EV to EBITDA multiple should only be made among companies that share similar characteristics and operate in similar industries.
Learn More → Enterprise Value Multiples by Sector (Source: NYU, Damodaran)
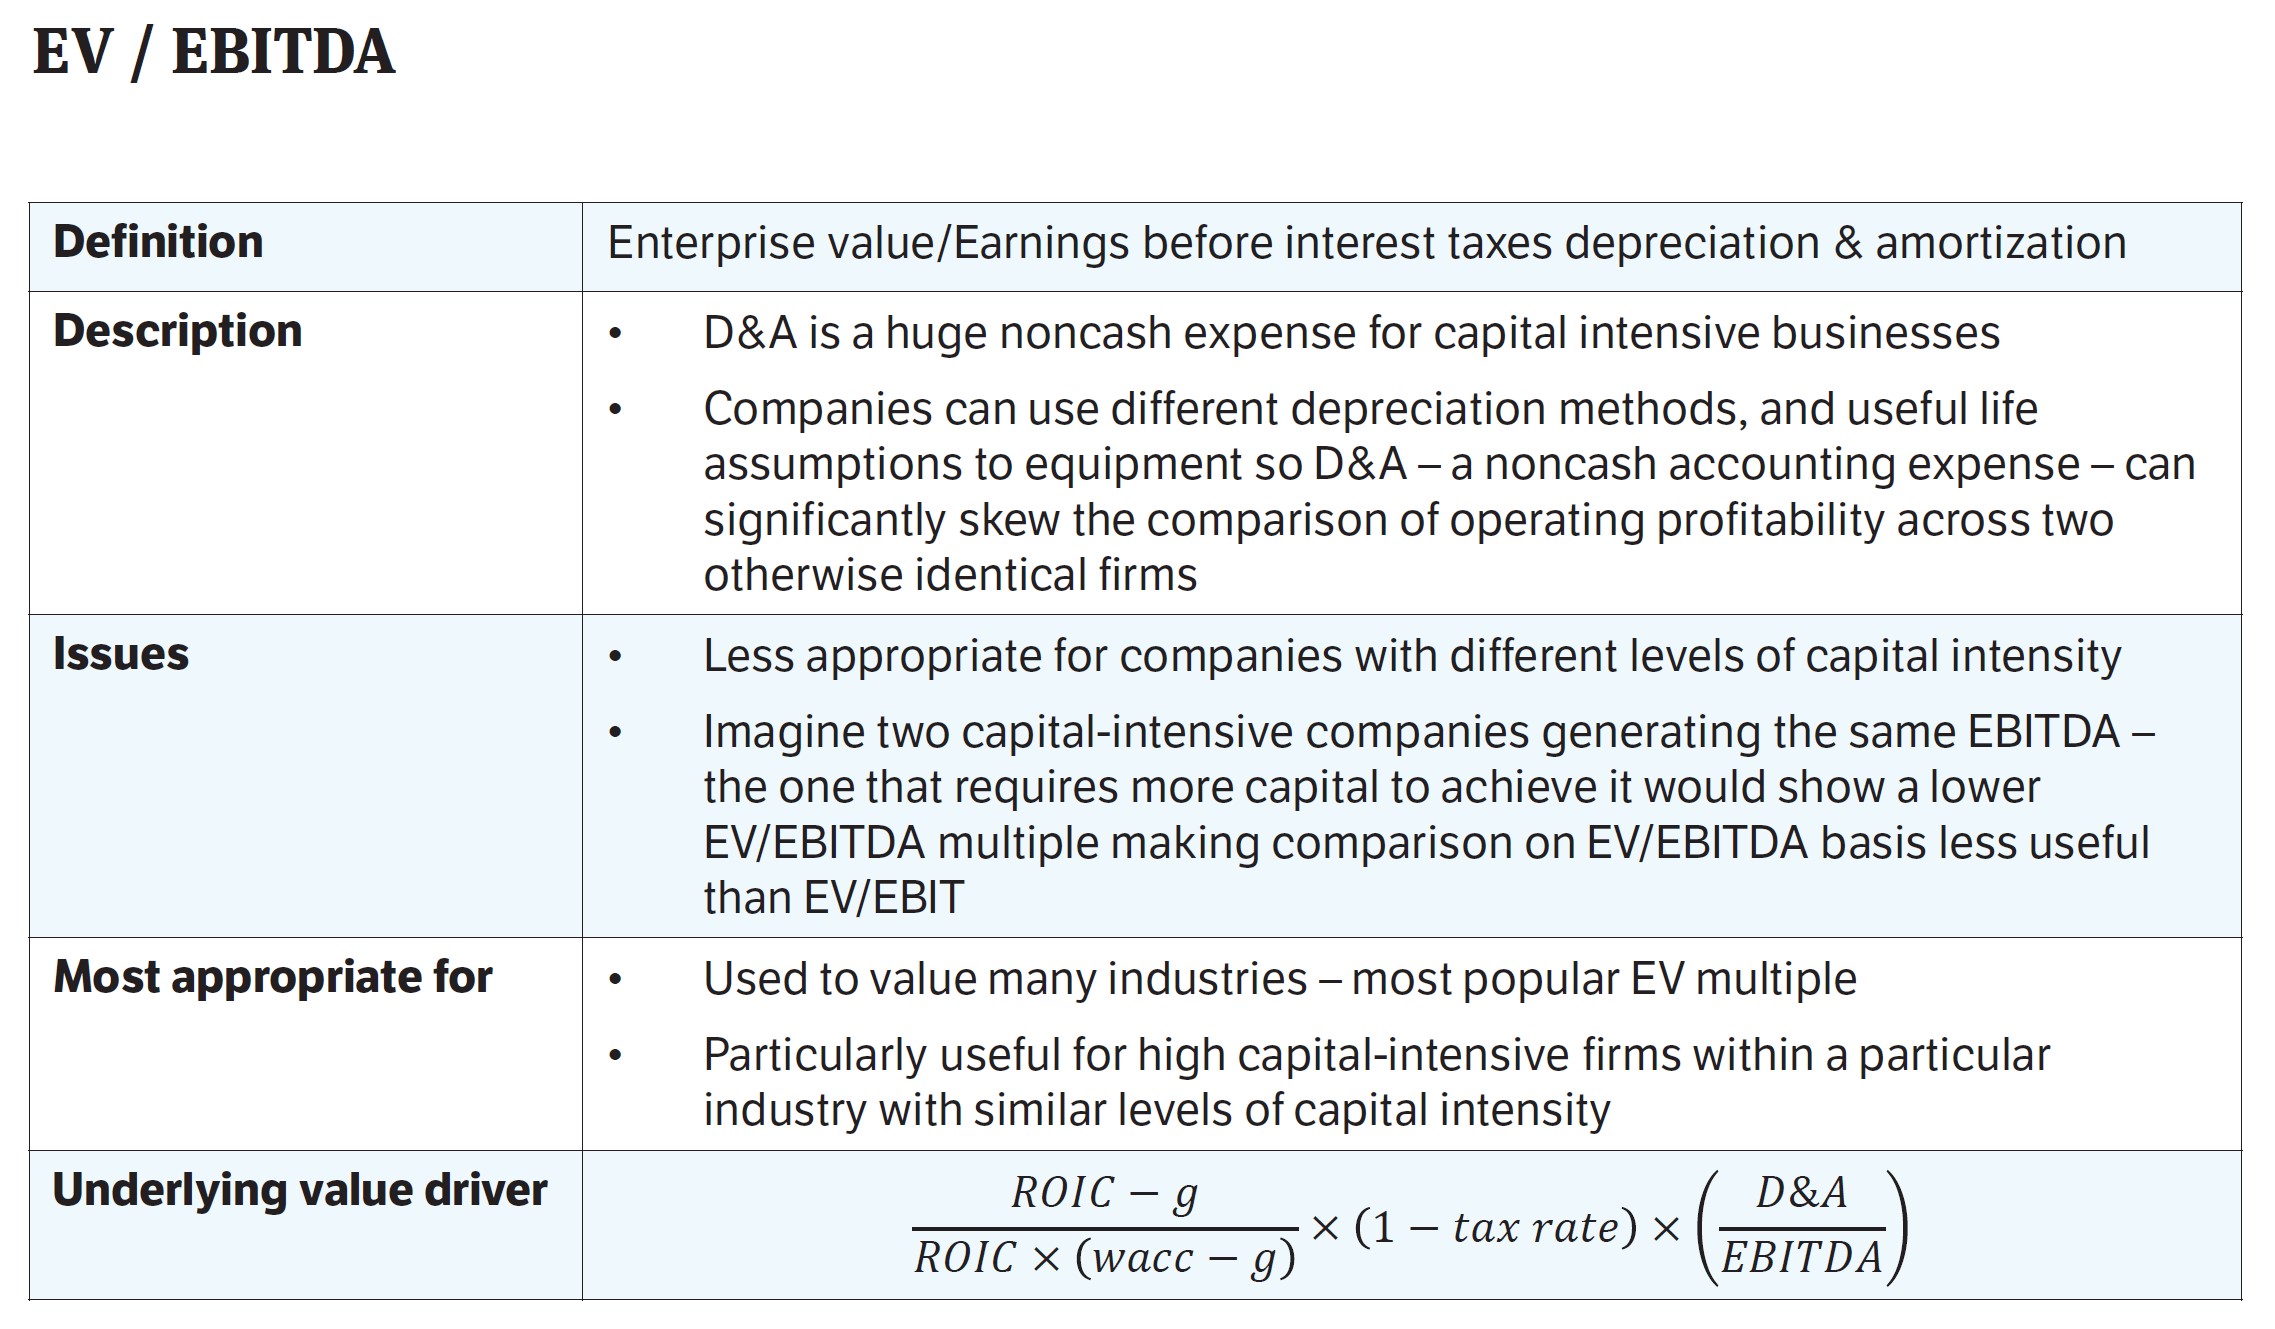
EV to EBITDA Multiple: What are the Pros and Cons?
For the most part, much of the criticism surrounding the usage of the EV/EBITDA multiple is around the EBITDA metric.
To many industry practitioners, EBITDA is not an accurate representation of a company’s true cash flow profile and can be misleading at times, especially for companies that are highly capital-intensive.
| EBITDA Pros | EBITDA Cons |
|
|
|
|
|
|
In certain scenarios, adjusted valuation multiples such as EV/(EBITDA – Capex) can be used instead, which is oftentimes seen in industries like the telecom industry where there is the need to account for capital expenditures due to the sheer degree of impact that CapEx has on the cash flows of companies in these types of industries.
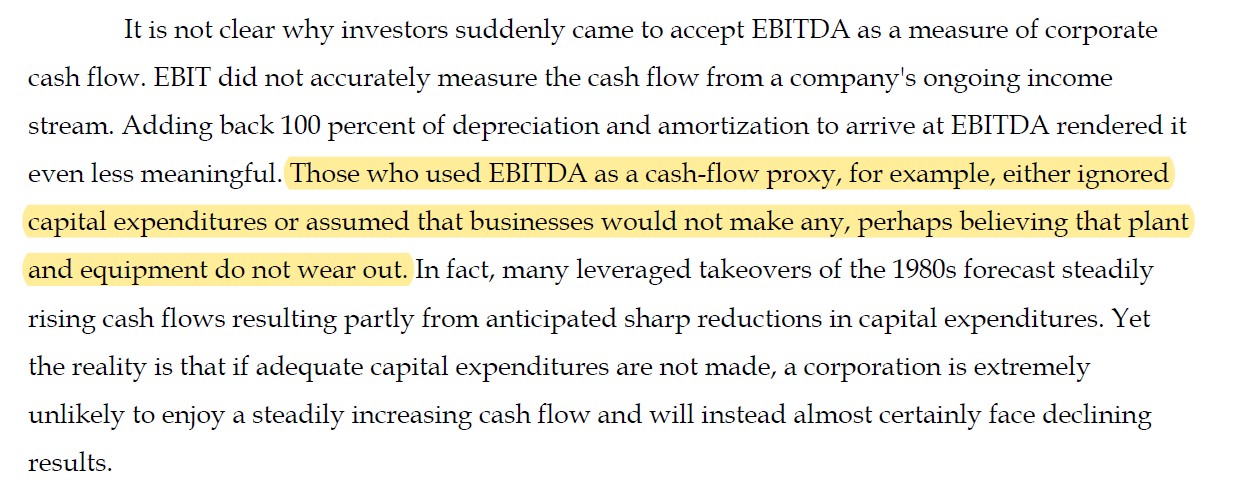
Seth Klarman on EBITDA
Seth Klarman Commentary on EBITDA (Source: Margin of Safety)
There is also much debate regarding the topic of “adjusted” EBITDA about whether certain line items should be added back or not.
One notable example would be stock-based compensation (SBC), as certain people view it as a straightforward non-cash add-back, whereas others focus more on the net dilutive impact it has.
But regardless of its shortcomings as a measure of profitability, EBITDA still removes the impact of non-cash expenses (e.g. depreciation and amortization) and remains one of the most commonly used proxies for operating cash flow.
EV/EBITDA Calculator
We’ll now move on to a modeling exercise, which you can access by filling out the form below.
1. Operating Assumptions
In our example exercise, we’ll be assuming three different scenarios for comparability, with the capital intensity of each company as the changing variable.
First, let’s begin with the financial data that applies to all companies (i.e. is being kept constant).
- Enterprise Value (EV) = $400m
- LTM EBIT = $40m
For all three companies, the value of the operations is $400m, while their operating income (EBIT) in the last twelve months (LTM) is $40m.
With those data points, we can calculate the EV/LTM EBIT using the simple formula:
- EV/LTM EBIT = $400m EV ÷ $40m LTM EBIT = 10.0x
All three companies have an EV/LTM EBIT multiple of 10.0x – but now, we must account for D&A.
- Low Capital Intensity → D&A = $10m
- Base Case → D&A = $25m
- High Capital Intensity → D&A = $40m
From the pattern above, we can recognize that the more capital-intensive the company, the higher the D&A expense.
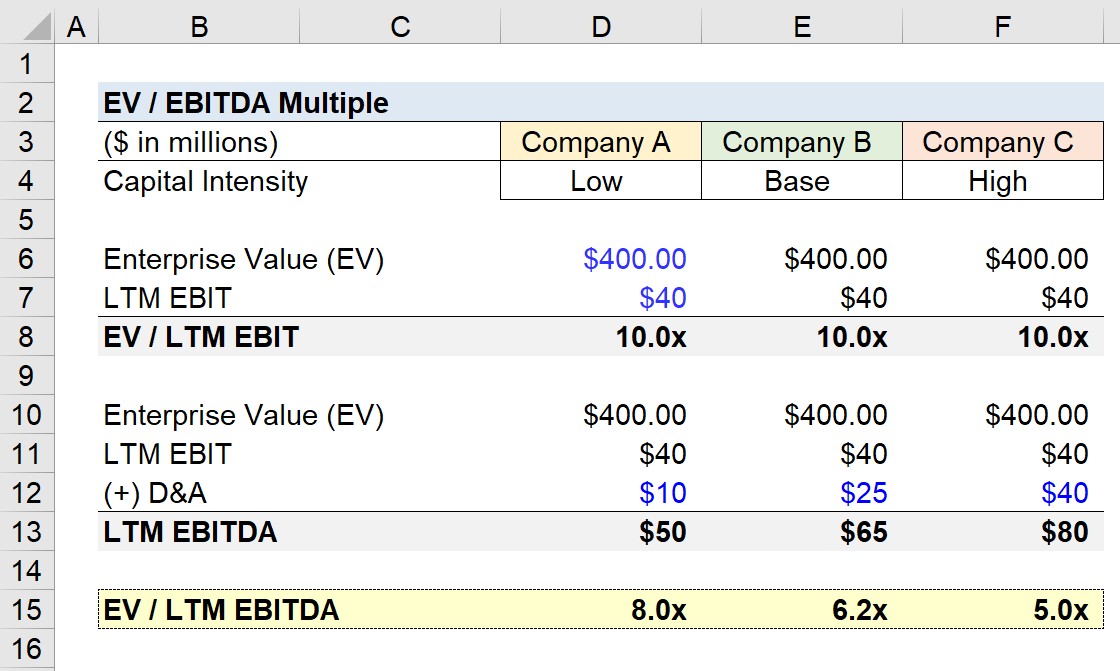
2. EV/EBITDA Calculation Example
Using those listed D&A figures, we can add the applicable amount to EBIT to calculate the EBITDA for each company.
- Company A (Low) → EBITDA = $40m + $10m = $50m
- Company B (Base) → EBITDA = $40m + $25m = $65m
- Company C (High) → EBITDA = $40m + $40m = $80m
Now, we can calculate the EV/EBITDA multiples for each company on an LTM basis.
- Company A (Low) → $400m EV ÷ $50m EBITDA = 8.0x
- Company B (Base) → $400m EV ÷ $65m EBITDA = 6.2x
- Company C (High) → $400m EV ÷ $80m EBITDA = 5.0x
3. EV/EBITDA Multiple Analysis
From our example calculation, we can see just how impactful the D&A non-cash add-back can be on the EV/EBITDA valuation multiple of a company.
At the EV/EBIT level, the three companies are all valued at 10.0x, yet the EV/EBITDA multiple shows a different picture.
EBITDA is a non-GAAP measure, therefore it is imperative to remain consistent in the calculation of EBITDA, as well as be aware of which specific items are being added back. Otherwise, the comps-derived valuation is susceptible to being distorted by misleading, discretionary adjustments.

Everything You Need To Master Financial Modeling
Enroll in The Premium Package: Learn Financial Statement Modeling, DCF, M&A, LBO and Comps. The same training program used at top investment banks.
Enroll Today


