- What is CAGR?
- How to Calculate CAGR
- CAGR Formula
- CAGR Calculation Example
- How to Use CAGR to Forecast
- What is the Conceptual Meaning of CAGR?
- What is a Good CAGR?
- CAGR Calculator — Excel Template
- 1. Revenue Growth Assumptions
- 2. CAGR Calculation Example
- 3. CAGR Calculation in Excel
- 4. CAGR Revenue Forecast Example
What is CAGR?
CAGR—or “Compound Annual Growth Rate”—is the annualized rate of growth in the value of an investment or financial metric over a stated period.
Conceptually, the CAGR metric measures the hypothetical growth rate, assuming that the percentage change occurred evenly at the same rate over each individual period, i.e. uniform timing.
Therefore, the CAGR effectively “smoothens” the growth rates for multiple periods into a single annualized growth rate.
- CAGR stands for "Compound Annual Growth Rate" and reflects the annualized rate of growth across a given time period that exceeds one year.
- CAGR is defined as the annualized growth rate in the value of a financial metric – such as revenue and EBITDA – or an investment across a specified period.
- CAGR is calculated to measure the rate of change, expressed on an annual basis, wherein the effects of compounding are factored into the growth rate metric.
- The formula to calculate CAGR starts by dividing the ending value by the beginning value, raising it to the power of one divided by the number of compounding periods, and subtracting by one.
- CAGR offers insights regarding the historical growth trajectory in the value of an investment or financial metric, which can then be referenced to project its future value (FV) using the present value (PV) and CAGR assumption.
How to Calculate CAGR
The compound annual growth rate (CAGR) is the rate of return required for the value of an investment or financial metric to grow from its beginning value to its ending value between two dates.
In simple terms, the CAGR answers the question, “At what growth rate must the metric grow at each [Period] to reach [Ending Value] from [Beginning Value] under the time frame of [Number of Periods]?”
The CAGR is the rate of return of an investment—or a financial metric like revenue—across a predefined period, expressed in terms of an annual percentage.
CAGR measures growth as if the underlying investment or metric had grown at a fixed rate while compounding on an annual basis.
Therefore, CAGR is an estimate of the rate of return per year based on the pattern of growth in historical periods.
The step-by-step process to calculate CAGR is as follows.
- Step 1 ➝ Divide the Ending Value (or Future Value) by the Beginning Value (or Present Value)
- Step 2 ➝ Raise the Resulting Figure to the Inverse of the Number of Compounding Periods (1 ÷ t)
- Step 3 ➝ Subtract by One to Convert the Implied CAGR into Percent Form
CAGR Formula
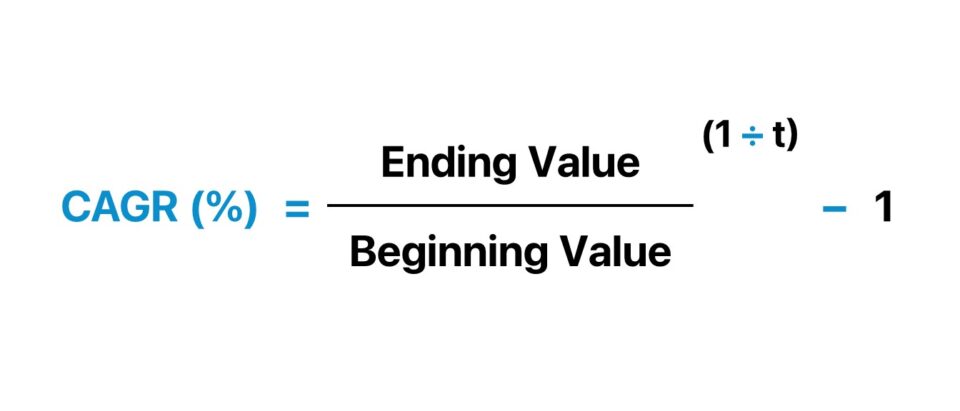
The compound annual growth rate (CAGR) formula is the ending value divided by the beginning value, raised to one divided by the number of compounding periods, and subtracts by one.
Where:
- Ending Value (or Future Value) ➝ The value at the end of the period (EoP).
- Beginning Value (or Present Value) ➝ The value at the beginning of the period (BoP).
- Number of Periods (t) ➝ The total number of compounding periods.
Or, the CAGR formula can also be expressed more formally using other financial terms.
The formula to calculate CAGR divides the future value (FV) by the present value (PV), raises the figure to one divided by the number of compounding periods, and subtracts by one.
Note: The difference between the CAGR formulas is merely the usage of financial jargon in the latter.
CAGR Calculation Example
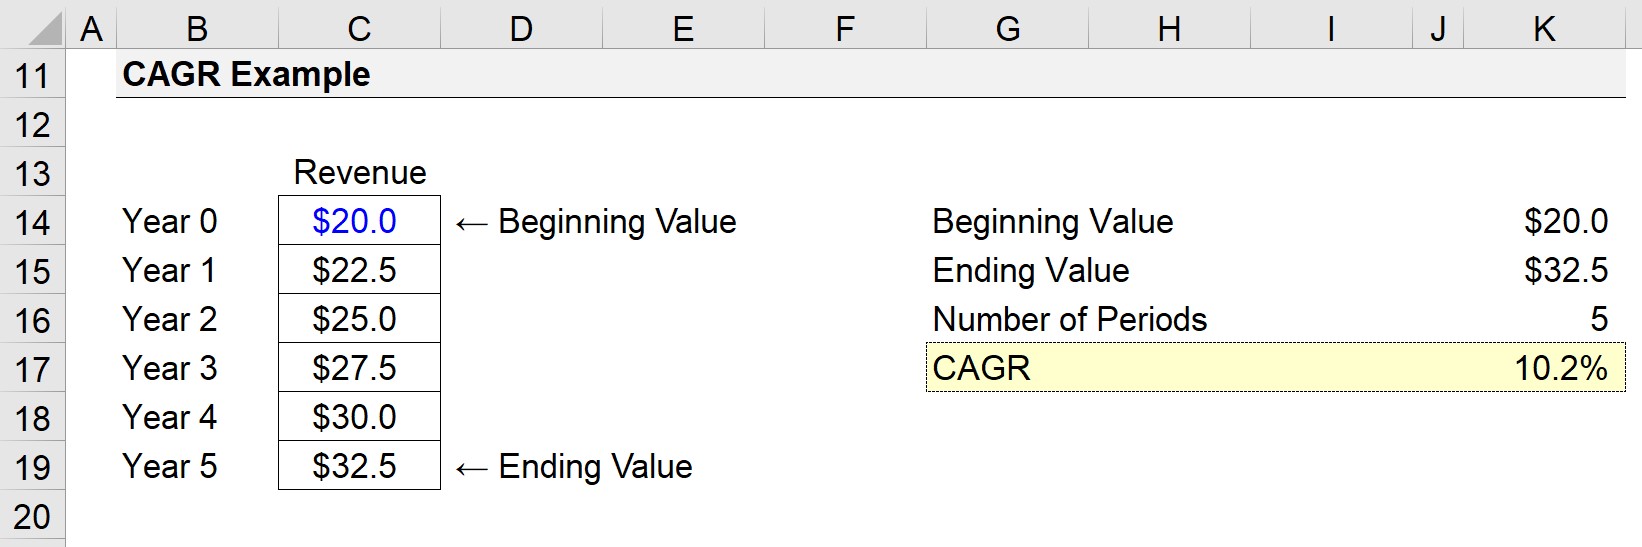
Suppose there is a company with revenue of $20 million at the end of the current period (Year 0).
Five years from the present date, the company’s revenue is projected to reach $32.5 million (Year 5).
Given those assumptions, we’ll enter the following figures into the CAGR formula:
- Beginning Value (Present Value) = $20 million
- Ending Value (Future Value) = $32.5 million
- Number of Periods = 5 Years
In the first part of the formula, the ending value of $32.5 million is divided by the starting value of $20 million.
The resulting figure must then be annualized by raising it to the power of 1 divided by the 5 periods.
Lastly, once we subtract 1 from the return value, we are left with a CAGR of 10.2%.
- Compound Annual Growth Rate (CAGR) = ($32.5 million ÷ $20.0 million)^ (1 ÷ 5 Periods) – 1
- CAGR (%) = 10.2%
Year 0 is excluded when counting the number of periods, because only the periods when the revenue is compounding must be counted.
Hence, the beginning period number is subtracted from the ending period number (i.e. Year 5 minus Year 0 = 5 Years).
How to Use CAGR to Forecast
One of the more practical use cases of the compound annual growth rate (CAGR), aside from understanding historical growth, pertains to forecasting.
- Historical CAGR Analysis ➝ Once the historical CAGR has been computed, the figure can be referenced to establish the operating assumptions that drive a forecast model.
- “Sanity Check” of Forecast Model ➝ The historical CAGR should exceed the projected CAGR in most cases, albeit there are often exceptions. Thus, the implied CAGR from the forecast period (i.e. forward-basis) can be compared to the historical CAGR (i.e. backward looking) to confirm the operating assumptions are reasonable. If not, adjustments to the assumptions might be necessary.
- Forecast Using CAGR ➝ The CAGR metric can also be used to directly forecast the future value (FV) of an asset, which we will elaborate upon shortly.
The future value (FV) of an asset can be forecasted using the following formula, wherein CAGR is an input.
For example, suppose an investment portfolio is worth $10 million at the moment, with a historical CAGR of 5.0% across the trailing five years.
Based on historical financial data, the CAGR of the investment is projected to be 3.0% across the next five years.
- Present Value (PV) = $10 million
- Historical CAGR, Trailing Five-Year Period = 5.0%
- Forecast CAGR Assumption, Forward Five-Year Period = 3.0%
- Number of Compounding Periods (t) = 5 Years
Given the 3.0% CAGR assumption, the value of the investment portfolio at the end of Year 5 should reach approximately $12 million.
- Future Value (FV), Year 5 = $10 million × (1 + 3%)^5 = $12 million
What is the Conceptual Meaning of CAGR?
The compound annual growth rate (CAGR) is a practical metric to facilitate sound decision-making, but it is critical to understand that the CAGR as a standalone metric still does not reveal the entire story.
To truly grasp the conceptual meaning of CAGR, it is necessary to comprehend the benefits, as well as the metric’s limitations.
Benefits of CAGR
- Removal of Fluctuations → Since annualized growth metrics remove the fluctuations of year-over-year (YoY) growth rates, the single percent rate facilitates comparisons of CAGR over time between two companies or investments, which would otherwise be challenging to compare.
- “Sanity Check” → Since the CAGR metric can confirm whether the projections align with the industry average and historical growth, the CAGR metric can also be useful as a “sanity check”, i.e. to confirm the assumptions are reasonable.
- Convenience → The relative ease at which the CAGR can be computed is a notable benefit to using the metric, while still providing valuable insights into the growth profile of anything that rises (or falls) in value.
Limitations of CAGR
- Volatility Risk → One drawback to the CAGR is that the metric neglects the volatility associated with the underlying asset. The growth rate can therefore be misleading in the absence of year-over-year (YoY) data. For instance, a company’s revenue growth could be inflated if the positive growth is front-ended in the earlier periods before tapering off.
- Operating Drivers → Annualized metrics such as the CAGR should not be taken at face value to minimize the risk of understating (or overstating) the growth potential without understanding the underlying operating drivers.
- Historical Performance (≠) Future Performance → Per usual, “past performance is no guarantee of future results”. Therefore, relying on the historical CAGR to build a pro forma forecast requires a certain degree of caution. The historical CAGR (or industry averages) should serve as a precedent to reference, as part of a more in-depth analysis of the company (or investment).
The Wharton Online & Wall Street Prep Applied Value Investing Certificate Program
Learn how institutional investors identify high-potential undervalued stocks. Enrollment is open for the Feb. 10 - Apr. 6 cohort.
Enroll TodayWhat is a Good CAGR?
Simply put, the percentage growth rate that constitutes a “good” CAGR is contingent on the company-specific fundamentals, the industry (or sector) benchmark established by comparable companies, and various other external factors.
- Mature (Late-Lifecycle) → Mature companies operating in long-standing industries (>10 years) with limited growth opportunities could have a projected five-year CAGR of around 3% to 5%, which could perhaps be perceived positively by investors in the market.
- Late-Stage (Growth Equity) → In contrast, growth-stage companies could view a CAGR of around 10% to 20% as the norm. Here, a company that expects revenue to grow at a CAGR of 3% to 5% is trailing behind the industry benchmark.
- Early-Stage (Venture-Backed) → Finally, early-stage companies such as startups could target a CAGR in excess of 50% (or even 100%), which are ambitious growth targets often required to raise enough funding from venture investors (VC).
Suppose a company’s revenue is projected to grow at a CAGR of 20%, but the company’s closest comparables are expected to grow around 5%, while the collective industry is forecast to grow 3% across the same periods.
The company’s growth assumptions would likely warrant adjustments of some sort, or at least a closer look into whether the projected figures are reasonable or not (“sanity check”).
If the assumptions are deemed reasonable, the company is likely to receive much attention (and capital) from investors, as its growth profile is an outlier within the industry, i.e. well-positioned to continue to grow at an outsized pace and become the market leader with the highest market share over the long-term.
Conversely, if the industry CAGR is projected to be 40% in the same time horizon – instead of 5% like our previous scenario – the company’s estimated growth is far behind its peers.
CAGR Calculator — Excel Template
We’ll now move on to a modeling exercise, which you can access by filling out the form below.
1. Revenue Growth Assumptions
Suppose we are tasked with calculating the compound annual growth rate (CAGR) of a company’s revenue.
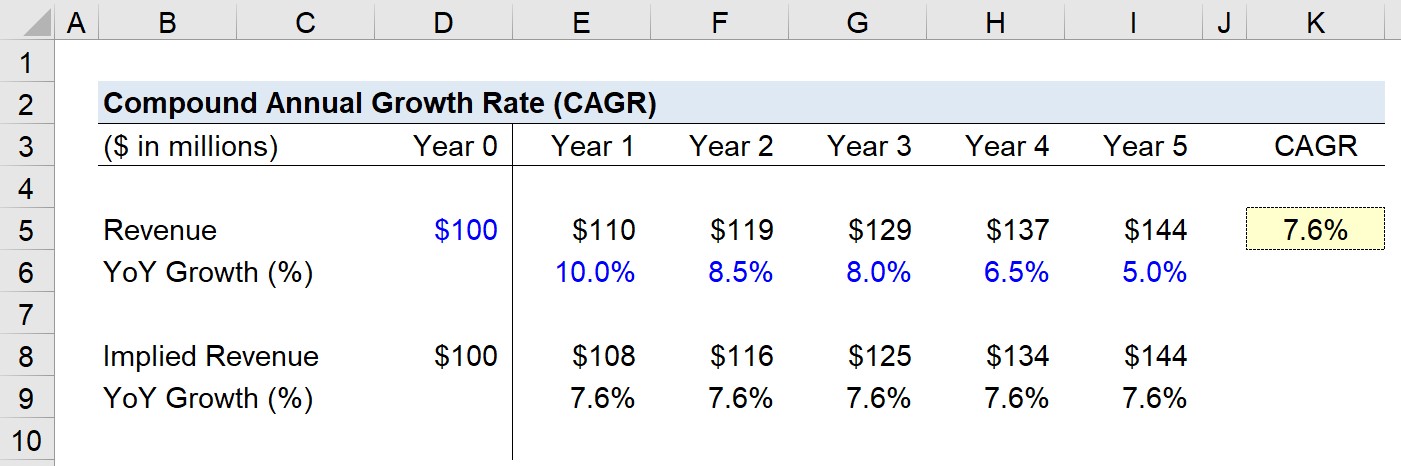
At the end of the current period, the company has generated $100 million in revenue – and this figure is expected to grow at the following growth rates each year.
- Year 0 → Year 1 = 10.0%
- Year 1 → Year 2 = 8.5%
- Year 2 → Year 3 = 8.0%
- Year 3 → Year 4 = 6.5%
- Year 4 → Year 5 = 5.0%
By the end of Year 5, the company’s revenue reaches $144 million, after starting at $100 million in Year 0.
- Revenue, Year 0 = $100 million
- Revenue, Year 1 = $110 million
- Revenue, Year 2 = $119 million
- Revenue, Year 3 = $129 million
- Revenue, Year 4 = $137 million
- Revenue, Year 5 = $144 million
2. CAGR Calculation Example
Like the previous example, we will input the following assumptions into the CAGR formula.
- Beginning Value (PV) = $100 million
- Ending Value (FV) = $144 million
- Number of Periods (t) = 5 Years
Our CAGR formula divides $144 million (i.e. the future value) by $100 million (i.e. the present value) and then raises it to 1 divided by 5 (i.e. the number of periods).
In the subsequent step, we subtract the resulting figure by one to arrive at 7.6% as the implied 5-year CAGR.
- CAGR (%) = ($144 million ÷ $100 million)^(1 ÷ 5 Periods) – 1 = 7.6%
3. CAGR Calculation in Excel
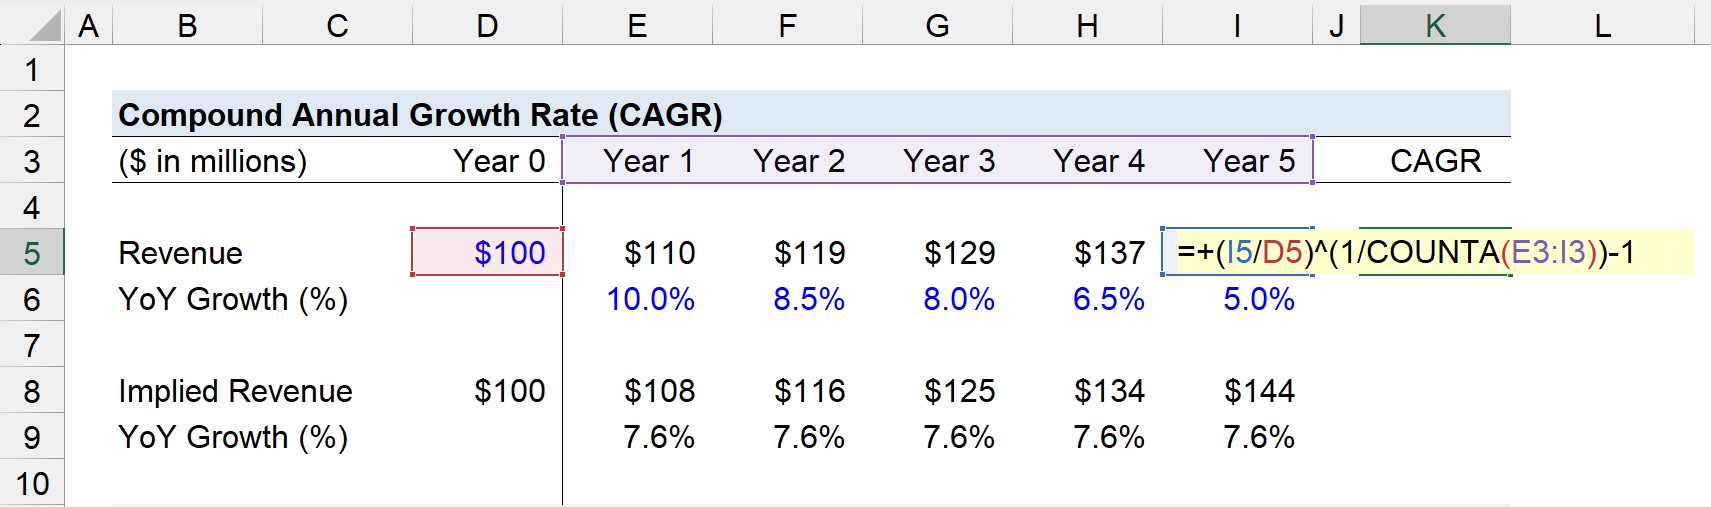
An alternative method to determine the historical or expected CAGR is to utilize the “RATE” function in Excel.
The COUNTA function can count the number of years (nper) for the first input, and we can hard-code a zero for the next input (pmt).
In the next steps, we can enter -$100 million for the present value (pv), and $144 million for the future value (fv), with a negative sign placed in front of either 1) the present value or 2) the future value.
For our illustrative example, the CAGR formula in Excel would be as follows.

4. CAGR Revenue Forecast Example
Contrary to a common misconception, the calculation of CAGR is not as simple as averaging the YoY growth rates.
But rather, given the initial value, ending value, and specific date parameters, the CAGR metric assumes the profits are reinvested each period and that interest is compounded annually.
To ensure you understand the concept of CAGR, we have also computed the implied revenue to illustrate how CAGR can be used to forecast a company’s revenue, or “sanity check” the assumptions that underpin a projection model.
In the section beneath the initial part of our quick modeling exercise in Excel – where we had computed the 5-year CAGR – we’ll start by linking to the cell containing the $100 million revenue assumption for Year 0 (Cell D5).
From that point onward, we will project our company’s revenue across the five-year forecast period, using the constant CAGR of 7.6% as the growth rate assumption in each period.
- Implied Revenue, Year 1 = $100 million × (1 + 7.6%) = $108 million
- Implied Revenue, Year 2 = $108 million × (1 + 7.6%) = $116 million
- Implied Revenue, Year 3 = $116 million × (1 + 7.6%) = $125 million
- Implied Revenue, Year 4 = $125 million × (1 + 7.6%) = $134 million
- Implied Revenue, Year 5 = $134 million × (1 + 7.6%) = $144 million
By growing the revenue of our hypothetical company by the 5-year CAGR of 7.6% each year, the company’s forecasted revenue reaches $144 million by the end of Year 5, confirming that our prior calculation of CAGR is, in fact, correct.