
- What is Days Inventory Outstanding?
- How to Calculate Days Inventory Outstanding (DIO)
- Days Inventory Outstanding Formula (DIO)
- What is a Good Days Inventory Outstanding?
- DIO vs. Inventory Turnover: What is the Difference?
- Days Inventory Outstanding Calculator (DIO)
- 1. Income Statement Assumptions
- 2. Inventory Turnover Ratio Calculation Analysis
- 3. Days Inventory Outstanding Calculation Example
- 4. Ending Inventory Balance Forecast Example (DIO)
What is Days Inventory Outstanding?
The Days Inventory Outstanding (DIO) is the number of days it takes on average before a company needs to replace its inventory.
DIO is often measured to improve a company’s go-to-market, sales and marketing (S&M), and product pricing strategies based on historical customer demand and spending patterns.
- Days inventory outstanding (DIO) measures the average number of days that a company retains its inventory on hand before selling it.
- The formula to calculate DIO starts with determining the average inventory balance and dividing that figure by cost of goods sold (COGS), and multiplying the result by the time period (usually 365 days).
- Conversely, the days inventory outstanding (DIO) can be calculated by dividing the number of days in a given period by the inventory turnover ratio.
- A lower days inventory outstanding (DIO) implies quicker inventory turnover and an efficient conversion strategy, contrary to a higher DIO ratio.
How to Calculate Days Inventory Outstanding (DIO)
DIO stands for “Days Inventory Outstanding”, and measures the number of days required for a company to sell off the amount of inventory it has on hand.
Therefore, companies are incentivized to minimize their days inventory outstanding (DIO) to reduce the time that inventory is sitting idly in their possession, since that implies its operating efficiency improved.
To calculate the days inventory outstanding (DIO) of a company, two inputs are necessary:
- Inventory Balance ➝ On the balance sheet, the inventory line item represents the dollar value of the raw materials, work-in-progress goods (WIP), and finished goods of a company.
- Cost of Goods Sold (COGS) ➝ On the income statement, the COGS line item represents the direct costs incurred by a company while selling its goods or services to generate revenue.
An increase in an operating working capital asset, such as inventory, represents an “outflow” of cash.
Hence, an increase in working capital—i.e. current operating assets minus current operating liabilities—causes a reduction in the free cash flow (FCF) of a company..
With that said, if the inventory balance of a company rises, that means more cash is tied up in the operations, since it is taking more time for the company to sell and cycle through its inventory compared to the time needed to produce it.
Days Inventory Outstanding Formula (DIO)
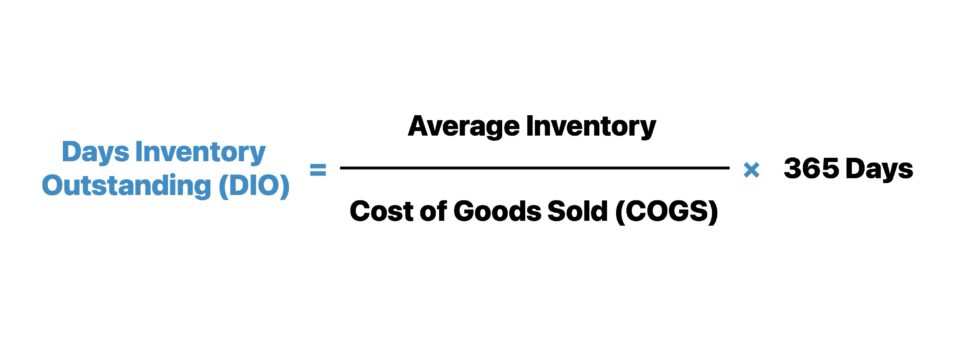
The formula to calculate days inventory outstanding (DIO) consists of dividing the average (or ending) inventory balance by cost of goods sold (COGS) and multiplying by 365 days.
Where:
- Average Inventory = (Beginning Inventory + Ending Inventory) ÷ 2
Conversely, a different method to calculate DIO is to divide 365 days by the inventory turnover ratio.
What is a Good Days Inventory Outstanding?
A comparative benchmarking analysis of a company’s inventory turnover and DIO relative to its industry peers provides useful insights into how well inventory is being managed.
The average inventory turnover and DIO varies by industry; however, a higher inventory turnover and lower DIO is typically preferred as it implies the management of inventory is closer to an optimal state.
In addition to being an indicator of ordering and inventory management efficiency, a high inventory turnover ratio and low DIO means higher free cash flows.
That is why the inventory turnover ratio and days inventory outstanding (DIO) are valuable metrics to track for companies, especially those selling physical products (e.g., retail, e-commerce).
| Higher Days Inventory Outstanding (DIO) | Lower Days Inventory Outstanding (DIO) |
|
|
|
|
|
|
DIO vs. Inventory Turnover: What is the Difference?
The concept of inventory turnover is closely tied to days inventory outstanding (DIO), as inventory turnover refers to how often a company’s inventory balance needs to be replenished (i.e., “turned over”) each year.
For purposes of forecasting, inventory is ordinarily projected based on either inventory turnover or days inventory outstanding (DIO).
Since a higher turnover ratio means the company is selling off its inventory balance more frequently, companies strive to increase the turnover count to minimize the retention of existing inventory to avoid the build-up of unsellable/low-demand products.
If the inventory turnover is higher relative to comparable companies in the same industry, that is perceived as a positive sign in most cases, as it implies:
- Effective Customer Acquisition Strategies → The company is selling off its products quickly (i.e., demand-based ordering, “just-in-time”).
- High Market Demand → There is adequate customer demand in the market for the product being offered.
- Market-Based Pricing → The pricing of the product appears to be set around a reasonable range, which stems from understanding the target market(s) and customer profile.
In contrast, a low inventory turnover ratio indicates the company is struggling to sell its products – meaning, less free cash flows since more of the FCFs are tied up in operations and cannot be deployed for other purposes.
The inventory turnover ratio compares the cost of goods sold (COGS) incurred by a company to either the average (or ending) inventory balance.
Note that the average between the beginning and ending inventory balance can be used for both the calculation of inventory turnover and DIO.
Why? The income statement covers a specific period, whereas the balance sheet is a snapshot at one particular point in time – thus, the average is used to prevent a timing mismatch between the numerator (an income statement item) and denominator (a balance sheet item).
However, in practice, the ending balance of inventory is often used for the convenience factor.
Unless the company operates in a highly seasonal industry with fluctuations in sales throughout the year, the difference between methodologies tends to be insignificant in most cases.
Days Inventory Outstanding Calculator (DIO)
We’ll now move on to a modeling exercise, which you can access by filling out the form below.
1. Income Statement Assumptions
Suppose we’re tasked with measuring the operating efficiency of a company, which reported a cost of goods sold (COGS) of $100mm and an inventory balance of $20mm in 2020.
Furthermore, the company’s COGS are expected to grow each year at a constant 5% growth rate year-over-year (YoY).
- Cost of Goods Sold (COGS) = $100 million
- Inventory = $20 million
- % COGS Growth – Step Function = +5% YoY
2. Inventory Turnover Ratio Calculation Analysis
Based on that information, we can calculate the inventory by dividing the $100mm in COGS by the $20mm in inventory to get 5.0x for the inventory turnover ratio in 2020.
The 5.0x inventory turnover ratio implies that, on average, the company goes through its inventory and must restock it five times per year.
- Inventory Turnover Ratio, 2020A = $100 million ÷ $20 million = 5.0x
3. Days Inventory Outstanding Calculation Example
Next, the company’s days inventory outstanding (DIO) can be calculated by dividing the $20mm in inventory by the $100mm in COGS and multiplying that by 365 days – which results in 73 days.
Therefore, the company requires roughly ~73 days to clear out its inventory, on average.
For purposes of simplicity, we are using the ending inventory balance in our formulas. But if you wanted to use the average inventory balance, it would just be the sum of the beginning and ending inventory balance divided by two.
In the next step, we will carry forward the inventory turnover assumption of 5.0x and the DIO assumption of 73 days to project future inventory levels.
- Inventory Turnover, 2020A = 5.0x
- Days Inventory Outstanding (DIO), 2020A = 73 Days
4. Ending Inventory Balance Forecast Example (DIO)
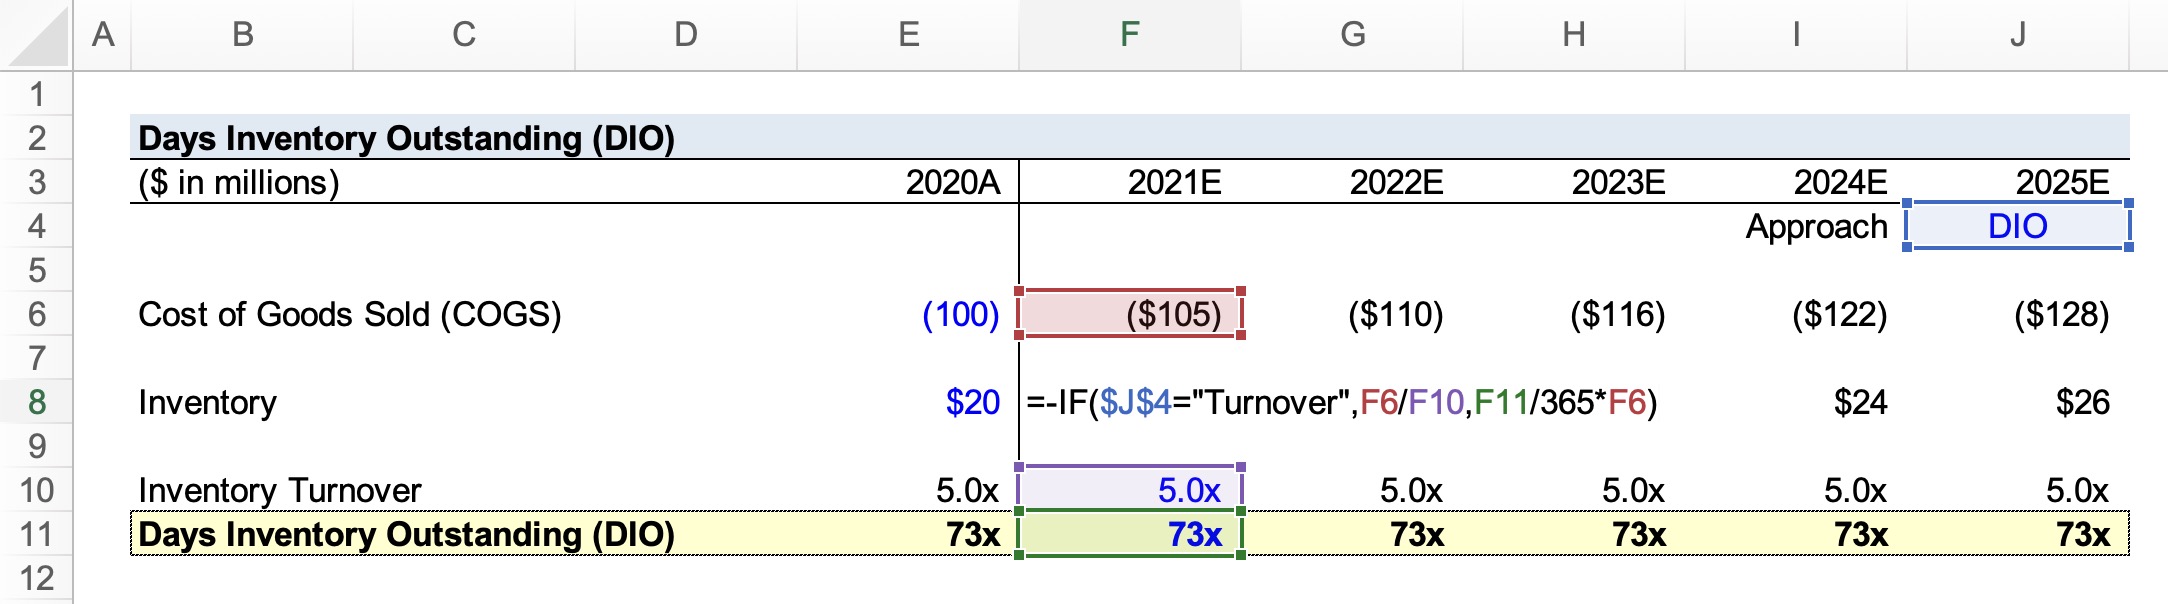
The switch toggle in the top right corner cycles between the two methods to forecast the inventory balance.
- “Turnover” Approach → If the toggle is set to “Turnover”, COGS is divided by the inventory turnover assumption.
- “DIO” Approach → If the switch is set to “DIO”, the days inventory outstanding (DIO) assumption is divided by 365 days and then multiplied by the COGS
On the job, it is far more common to see models that project inventory using the DIO approach (often denoted as “Inventory Days”) than based on turnover days.
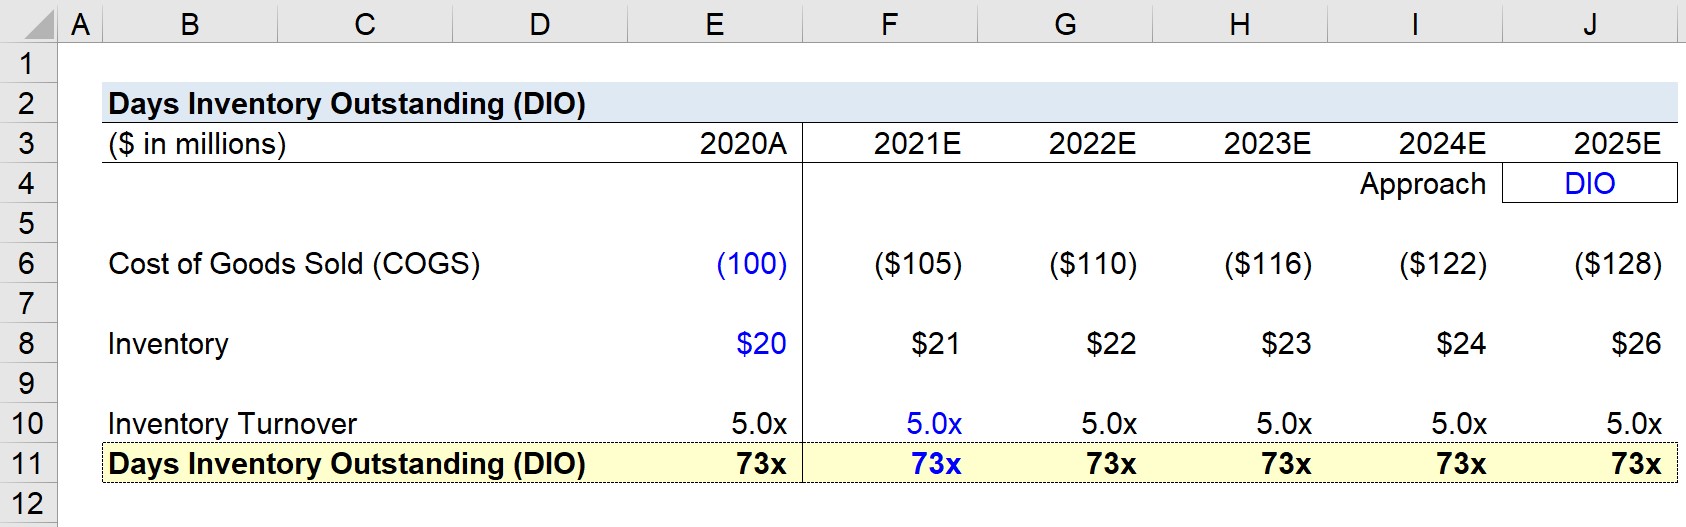
However, the projected inventory balances are equivalent under both approaches, as confirmed by our completed model.
From our starting period (2020) to the final year of the forecast (2025), we can see how our company’s inventory balance has increased by $20 million to $26 million.
- Ending Inventory Balance, 2021E = $21 million
- Ending Inventory Balance, 2022E = $22 million
- Ending Inventory Balance, 2023E = $23 million
- Ending Inventory Balance, 2024E = $24 million
- Ending Inventory Balance, 2025E = $26 million

Everything You Need To Master Financial Modeling
Enroll in The Premium Package: Learn Financial Statement Modeling, DCF, M&A, LBO and Comps. The same training program used at top investment banks.
Enroll Today


