
- What is Budget to Actual Variance Analysis?
- What is the Role of Budget to Actual Variance Analysis?
- How to Perform Budget to Actual Variance Analysis
- Budget to Actual Variance – Excel Template
- The Classic: Budget to Actual Variance
- Variance to Prior Period and Same Period Prior Year
- Year-to-Date (YTD) and Forecast
- How to Interpret the Budget to Actual Variance Analysis
What is Budget to Actual Variance Analysis?
Budget to Actual Variance Analysis is among one of the key functions for a FP&A professional to perform while on the job.
A budget to actual variance analysis is a process by which a company’s budget is compared to actual results and the reasons for the variance are interpreted.
 What is the Role of Budget to Actual Variance Analysis?
The purpose of budget to variance analysis is to provoke questions such as:
- Why did one division, product line or service perform better (or worse) than the others?
- Why are selling, general and administrative expenses higher than last year?
- Are variances being caused by execution failure, change in market conditions, competitor actions, an unexpected event or unrealistic forecast?
The basis of virtually all variance analysis is the difference between actuals and some predetermined measure such as a budget, plan or rolling forecast. Most organizations perform variance analysis on a periodic basis (i.e. monthly, quarterly, annually) in enough detail to allow managers to understand what’s happening to the business while not overburdening staff.
How to Perform Budget to Actual Variance Analysis
Variances fall into two major categories:
- Favorable variance: Actuals came in better than the measure it is compared to.
- Negative variance: Actuals came in worse than the measure it is compared to.
When explaining budget to actual variances, it is a best practice to not to use the terms “higher” or “lower” when describing a particular line time. For example, expenses may have come in higher than planned, but that produces a negative variance to profit.
In addition, variances are relative to an organization’s key performance indicators (KPIs). If the organization utilizes a driver-based, flexible budget or plan where production costs come in higher in a period due to increased sales volume, than that may have a positive effect on organizational profit and show that in the budget to actual variance analysis.
Most variance analysis is performed on spreadsheets (Excel) using some type of template that’s modified from period to period. Most enterprise systems have some type of standard variable reporting capability, but they often do not have the flexibility and functionality that spreadsheets provide. Given the very ad hoc nature of variance analysis, spreadsheets are a very useful tool.
Learn More → FP&A Job Description and Responsibilities
The Wharton Online and Wall Street Prep Financial Planning & Analysis (FP&A) Certificate Program
Elevate your finance career with Wharton's globally recognized FP&A Certificate Program. Enrollment is open for the Feb. 10 - Apr. 6 cohort.
Enroll TodayBudget to Actual Variance – Excel Template
The Classic: Budget to Actual Variance
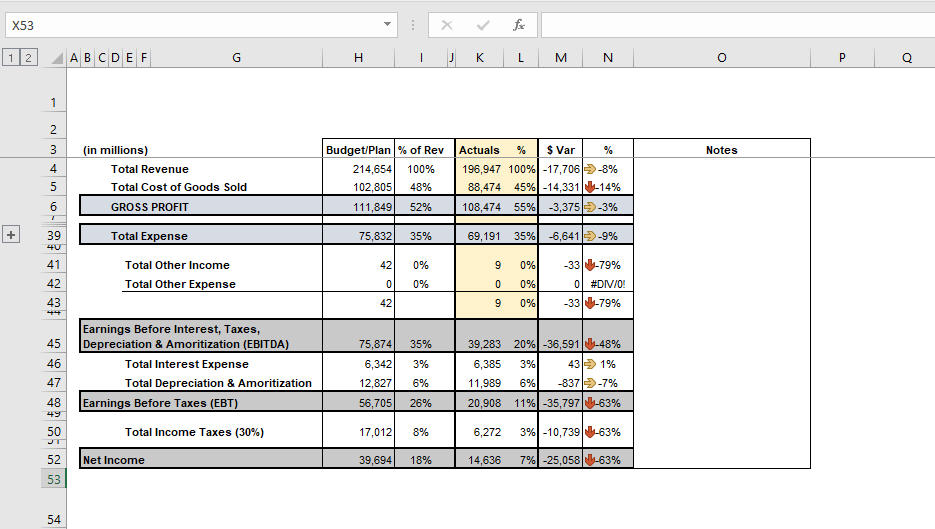
You can never go wrong with a classic. Most people are familiar with what an actual to budgeted/plan variance analysis looks like. It is, as its name states, the comparison of actual results to budgeted/planned results. (And by adding some conditional formatting as in the screenshot below, you can more quickly identify where areas of opportunity lie.)
Variance to Prior Period and Same Period Prior Year
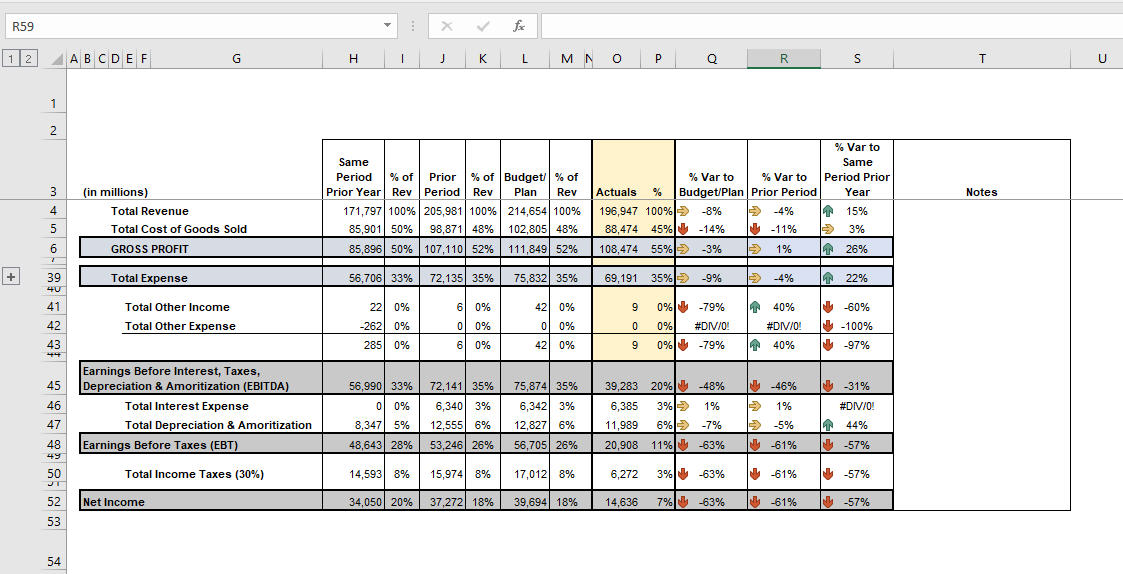
Taking the classic variance analysis one step further, an analyst can compare actuals to the period immediately prior and to the same period the prior year. Analyzing variances in this way will help bring to light potential changes in seasonality and timing changes that can help to correct future forecasts. (As a side note, it’s good practice to write notes on the variances directly on the variance analysis to the right of the data, as in the screenshot below).
Year-to-Date (YTD) and Forecast
An FP&A professional who has setup a variance analysis with the steps above might think she has a good handle on things, but there are two things management really wants to know that she can’t yet answer:
- How are we tracking against budget/plan so far?
- Are we going to hit, miss or exceed our annual targets based on new information?
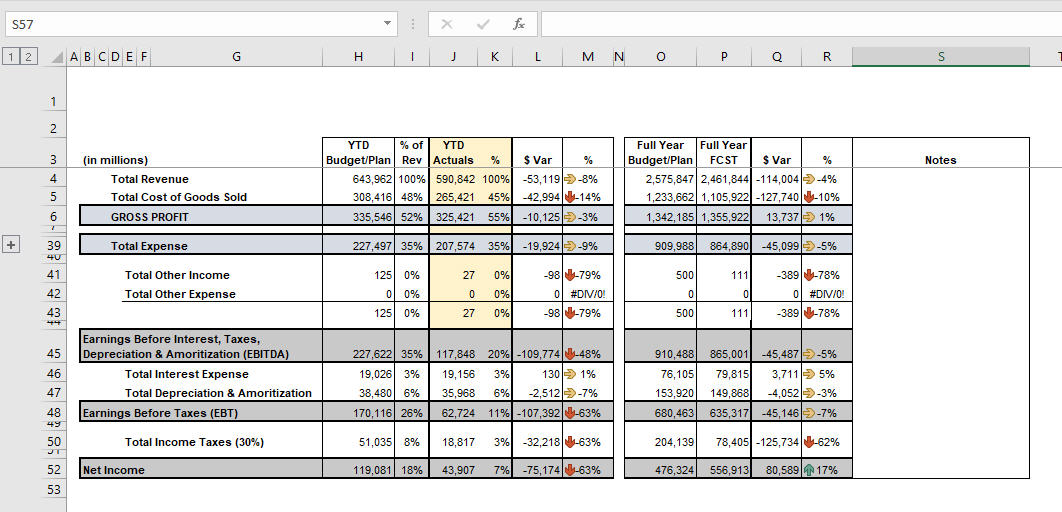
To do this, the analyst needs to compare YTD actuals against YTD budget/plan as well as the full year budget/plan against the full year updated forecast, which would look like this:
How to Interpret the Budget to Actual Variance Analysis
After performing the variance analysis steps above, an FP&A analyst needs to put on the “investigator hat,” go to the business areas, and ask what and why: What is driving the variances? Why were targets missed, hit or exceeded?
To test the underlying business logic, an analyst can:
- Analyze the elasticity of inputs (i.e. what is the impact of a 1 basis point change in iPhone margins on profit margins?).
- Look for offsetting or magnifying variances that may cause an inaccurate model to appear accurate at points in time.
- Using the same model, forecast the time horizon using only historical data. (What would have happened and why?)
The use of dashboards, sensitivity analysis and scenario analysis are an essential part of this interpretation process.
The analyst should also set levels of materiality. Does it matter if million dollar + line item is $100 off? Probably not.
In addition, it is important that, when seeking variance explanations, an FP&A analyst should come to the table prepared with as much data as possible. If you can help answer a variance explanation question with further data analysis utilizing the organization’s information systems, you will be much more appreciated than if you simply ask the question and expect a quick response.
Lastly, don’t just settle for an answer. Probe further to find out how you can help the business with whatever the relevant teams are struggling with. For example, if a business unit did not hit targets because it was unable to hire qualified staff in time, talk to Human Resources and find out if any initiatives are in place to correct this.


")

A key for the arrows, and which are associated with favorable or negative variance, and quick explanation of them should be included with this example. Many owner’s want to see this table on their monthly executive summary variance analysis, and may not understand at first glance the meaning of these… Read more »
Hey, can you tell how to make these arrows in excel?