
How to Forecast the Income Statement
Forecasting the income statement is a key part of building a 3-statement model because it drives much of the balance sheet and cash flow statement forecasts.
In the following guide, we address the common approaches to forecasting the major line items in the income statement in the context of an integrated 3-statement modeling exercise.
Income Statement Historical Data
Before any forecasting can begin, we start by inputting historical results. The process involves either manual data entry from the 10K or press release, or using an Excel plugin through financial data providers such as Factset or Capital IQ to drop historical data directly into Excel.
Here is Apple’s 2016 income statement:
Inputting Historical Income Statement Data: Common Issues
When inputting historical income statement data, several issues are usually encountered:
Deciding the level of revenue (sales) detail
Some companies report segment- or product-level revenue and operating detail in footnotes (which roll up into the consolidated income statement). For example, while Apple provides a consolidated “net sales” figure in the income statement, the footnotes provide sales by product (iPhone, iPad, Apple Watch, etc.).
If it’s important that the final model includes a scenario analysis — for example, what if iPhone unit sales are better than expected, but the iPhone average selling price is worse than expected? — a detailed historical segment breakout is useful to provide a foundation for forecasts. Otherwise, relying on the net sales line on the income statement is sufficient.
Line item classification
Not all companies classify their operating results the same way. Some companies will aggregate all operating expenses into one line, while others will break them into several line items. If our model will be used to compare performance across other firms, the classifications need to be apples-to-apples and often require us to make judgments on how to classify line items and whether to hunt for more detailed breakdowns in the financial footnotes.
For example, notice that Apple’s 2016 income statement above contains a line called “Other income/(expense), net” of $1,348 million. This line aggregates interest expense, interest income and other non-operating expenses, as we can see in Apple’s 10K footnotes:
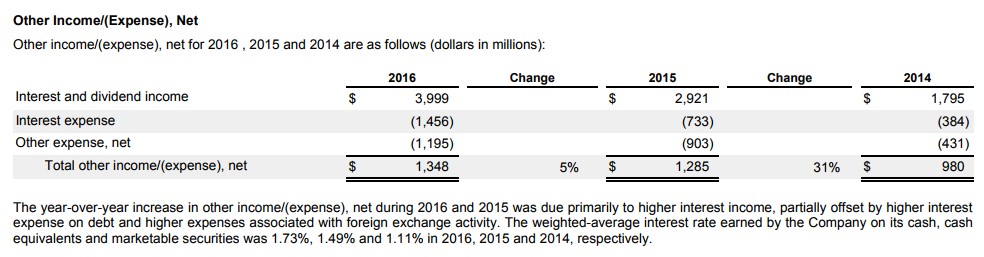
Since 3-statement financial models need to forecast future interest expense based on debt levels and interest income based on future cash levels, we needed to identify and use the more detailed breakout provided in the footnotes.
Data scrubbing
Companies prepare their historical income statement data in line with US GAAP or IFRS. That means income statements will not contain financial metrics like EBITDA and Non GAAP operating income, which ignore certain items like stock-based compensation. As a result, we often have to dig in footnotes and other financial statements to extract the data needed to present income statement data in a way that’s useful for analysis.
Putting it all together
Below is an example of how to input Apple’s historical results into a financial model:
If you compare it with Apple’s actual income statement (shown previously) you’ll notice several differences. In the model:
- Other income is broken out to explicitly show interest expense and interest income.
- Depreciation and amortization as well as stock based compensation is explicitly identified in order to arrive at EBITDA.
- Growth rates and margins are calculated.
Notice the adherence to several financial modeling best practices including:
- Formulas are colored black and inputs are blue.
- The model presents data from left to right (unfortunately companies report results from right to left).
- Decimal places are consistent (two for per-share data, none in Apple’s case for operating results).
- Negative numbers are in parentheses.
- Expenses are all negative (not all models follow this convention — the key here is consistency).
How to Project the Income Statement
Once the historical data is inputted into the model, forecasts can be made. Before diving in, let’s establish a few realities of forecasting.
Effective forecasting has very little to do with modeling
While our focus in this article is to give you guidance on the mechanics of effective modeling, a much more important facet of forecasting is something this guide cannot provide: A deep understanding of the business and industry in question. To forecast a company’s revenue, an analyst must have an understanding of the company’s business model, key customers, addressable market, competitive position and sales strategy. Garbage in = garbage out, as the old saying goes.
Your role will determine how much time you spend on getting the assumptions right
Most investment banking analysts spend very little time conducting the due diligence required to arrive at their own assumptions. Instead, they rely on equity research and management estimates to provide a “management case” and “street case” for future performance. Then the analyst ideally builds other cases that should show what would happen if the street and management cases don’t materialize. That’s why a lot of people knock investment banking models as all style and no substance. On the other hand, a buy side or private equity analyst will spend far more time understanding the businesses they are considering as an investment. If they get the assumptions wrong, after all, their returns will suffer.
Messy models are useless
Assumptions are the most important part of getting a model “right.” But a model that is messy, error-prone and is not integrated will never be a useful tool despite great underlying assumptions.
Forecasting Revenue
The revenue (or sales) forecast is arguably the single most important forecast in most 3-statement models. Mechanically, there are two common approaches for forecasting revenue:
- Grow revenues by inputting an aggregate growth rate.
- Segment level detail and a price x volume approach.
Approach 1. is straightforward. In our example, Apple’s revenue growth last year was 9.2%. If, for example, the analyst expected that growth rate to persist throughout the forecast period, revenue would simply be grown at that rate.
Segment level detail and a price x volume approach
Alternatively, if the analyst has a thesis on changes in price and volume by segment, a more comprehensive forecast approach is required. In this case, the analyst would make explicit assumptions for volume and price by each segment. In this case, instead of explicitly forecasting a consolidated growth rate, the consolidated growth rate is an output of the model based on the price/volume segment buildup.
Segment level detail and a price volume buildup for Apple
Forecasting Cost of Goods Sold (COGS)
Make a percentage gross profit margin (gross profit/revenue) or percentage COGS margin (COGS/revenue) assumption and reference that back into the dollar amount of COGS. Historical margins help to provide a benchmark which the analyst can either straight-line into the forecast period or reflect a thesis that emerges from a particular viewpoint (which the analyst develops on their own, or more likely from equity research).
Forecasting Operating Expenses (Opex)
Operating expenses include selling costs, general and administrative expenses and research and development expenses. All of these expenses are driven by revenue growth or by an explicit expectation for possible changes in margin. For example, if last year’s SG&A margin was 21.4%, an “We don’t have a thesis on SG&A”-forecast for next year would simply be to straight-line the prior year’s 21.4% margin. Obviously, if we do expect changes, it would usually be reflected with an explicit change to the margin assumptions.
Forecasting Depreciation and Amortization (D&A)
Depreciation and amortization expenses are usually not classified explicitly on the income statement. Rather, they are embedded within other operating expense categories. However, you usually need to forecast D&A in order to arrive at an EBITDA forecast. Since D&A expenses are a function of historical and expected future capital expenditures and purchases of intangible assets, they are actually forecast as part of the balance sheet build-up and referenced back into the income statement after the buildup is complete.
Forecasting Stock-Based Compensation Expense (SBC)
Like D&A, stock-based compensation is embedded within other operating expense categories, but the historical amounts can be explicitly found on the cash flow statement. Stock-based compensation is usually forecast as a percentage of revenue.
Forecasting Interest Expense
Like forecasting depreciation and amortization, forecasting interest expense is done as part of the balance sheet buildup in a debt schedule and is a function of projected debt balances and the projected interest rate.
Interest expense is determined based on the company’s debt balances and interest income is determined based on the company’s cash balances. Analysts calculate interest in financial models using one of two approaches:
- Interest rate × Average Period Debt: For example, if your model is forecasting a $100m debt balance in the end of 2019 and $200m at the end of 2020, at an assumed interest rate of 5%, the interest expense would be calculated as $150m (average balance) x 5% = $7.5m.
- Interest Rate × Beginning Period Debt: Under this approach, you would calculate interest off the beginning of period balance (which is last year’s end of period balance) of $100m x 5% = $5m.
Which approach is better?
Conceptually, forecasting using average debt is considered more logical because debt balances change over the period. However, debt (and more specifically revolver debt) is often used as plug in a model, and when using average debt, this creates a circularity in the model. Circularity is problematic in Excel, and that’s why analysts often use beginning debt balances instead.
Forecasting Interest Income
While revolver debt is usually the deficit plug, cash is the surplus plug such that any excess cash flows forecast by the model naturally lead to higher cash balances on the balance sheet. This means that we deal with the same circularity issues here as we do when forecasting interest income. Interest income is a function of projected cash balances and the projected interest rate earned on idle cash.
We can only forecast it once we complete both the balance sheet and the cash flow statement. Like interest expense, analysts can calculate interest by using either the beginning- or average-period approach. And like interest expense, if you forecast interest income based on average cash balances, you’ll be creating a circularity.
Forecasting Other Non-Operating Items
In addition to interest income and interest expense, companies may have other non-operating income and expenses presented on the income statement, for which the nature is not explicitly disclosed. Those items are usually best forecast on a straight-line basis (as opposed to operating expenses, which are usually tied to revenue growth).
Forecasting Income Taxes
Usually, simply straight-lining the last historical year’s tax rate is sufficient. However, there are times where tax rates historically are not indicative of what a company can reasonably expect to face in the future. Learn more about this in our article on modeling tax rates.
Forecasting Shares Outstanding and Earnings Per Share (EPS)
The last element of the income statement forecast is forecasting shares outstanding and EPS. We cover this in our primer on forecasting shares and EPS.

Everything You Need To Master Financial Modeling
Enroll in The Premium Package: Learn Financial Statement Modeling, DCF, M&A, LBO and Comps. The same training program used at top investment banks.
Enroll Today


Thanks for putting together a great article. I’m sure I’ll have more questions.
how did you get forecast number for 2014-2018 base off the actual from 2011-2013? I would love if you could send me this excel file.
What technique would you choose to forecast the Income Statement in future fiscal years? Why?
Do you use Net interest expense in debt schedule or interest expense?
Hi everyone, I have a question, does anyone know if Apple have capital /Financing leases? Because I couldn’t find it in the companies 10k. I search the note but I only find operating. Also, how I can I derive PP&E if I only have commercial paper. I mean Proceeds from/(repayments… Read more »
What’s the forecasted EBIT based on the information below?
Revenues: 56,000
Cost of goods sold: 32,000
SG&A: 8,500
Depreciation: 2,700
Interest: 1,200
Taxes: 3,800
Review Later
15,500
7,800
11,600
12,800